Content
- Choropleth Mapping with in R
- Type of choropleth map
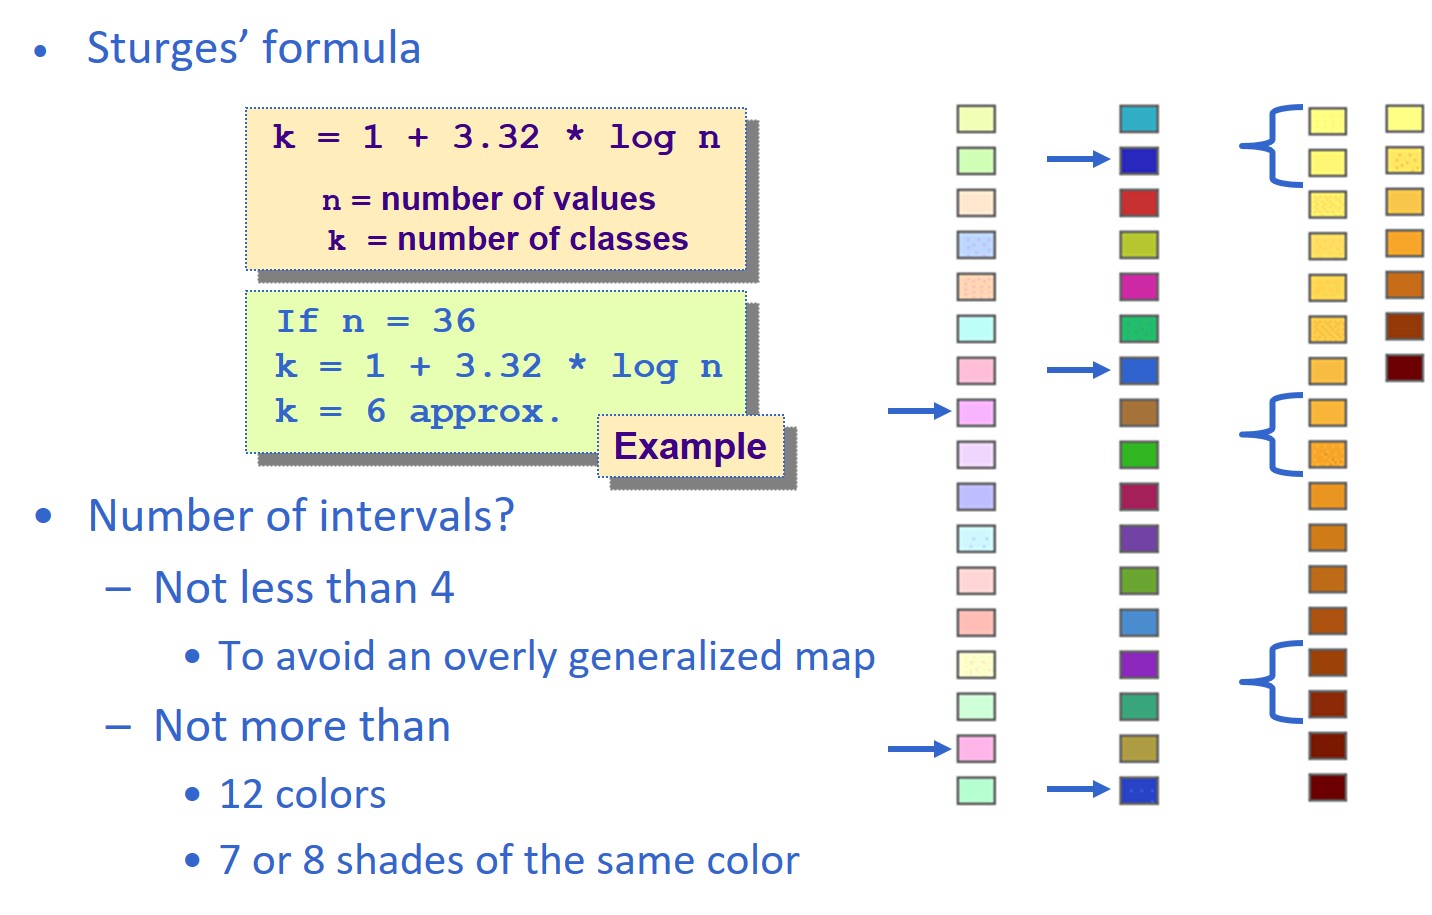
- Choosing number of classes
- Data classification methods
- Selecting colour scheme
- tmap Methods
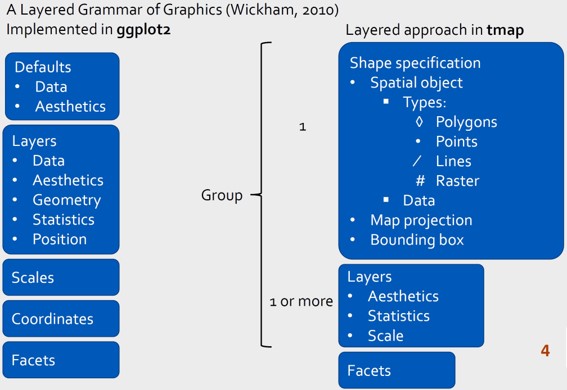
- tmap framewok
- tmap elements
- tmap layers
- tmap layout
- tmap style
- tmap facet
21 Feb 2023
A choropleth map is a type of thematic map in which areas are shaded or patterned in proportion to a statistical variable that represents an aggregate summary of a geographic characteristic within each area, such as population or per-capita income.
Caution
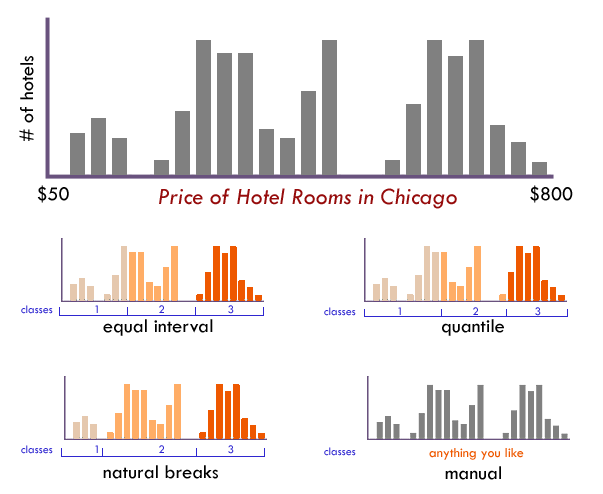
Avoid equal interval if your data are skewed to one end or if you have one or two really large outlier values. Outliers in that case will likely produce empty classes, wasting perfectly good classes with no observations in them. Since the hotel data above doesn’t have really large outliers, this is a data distribution that works well with equal interval.

qtm()The easiest and quickest to draw a choropleth map using tmap is using qtm(). It is concise and provides a good default visualisation in many cases.
tmap_mode() with “plot” option is used to produce a static map. For interactive mode, “view” option should be used.
fill argument is used to map the attribute (i.e. DEPENDENCY)
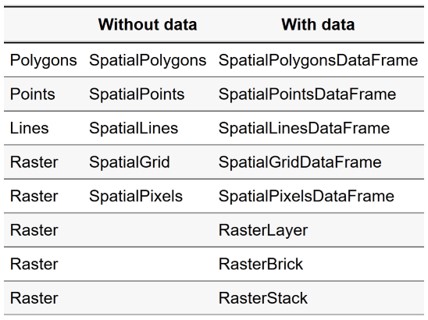
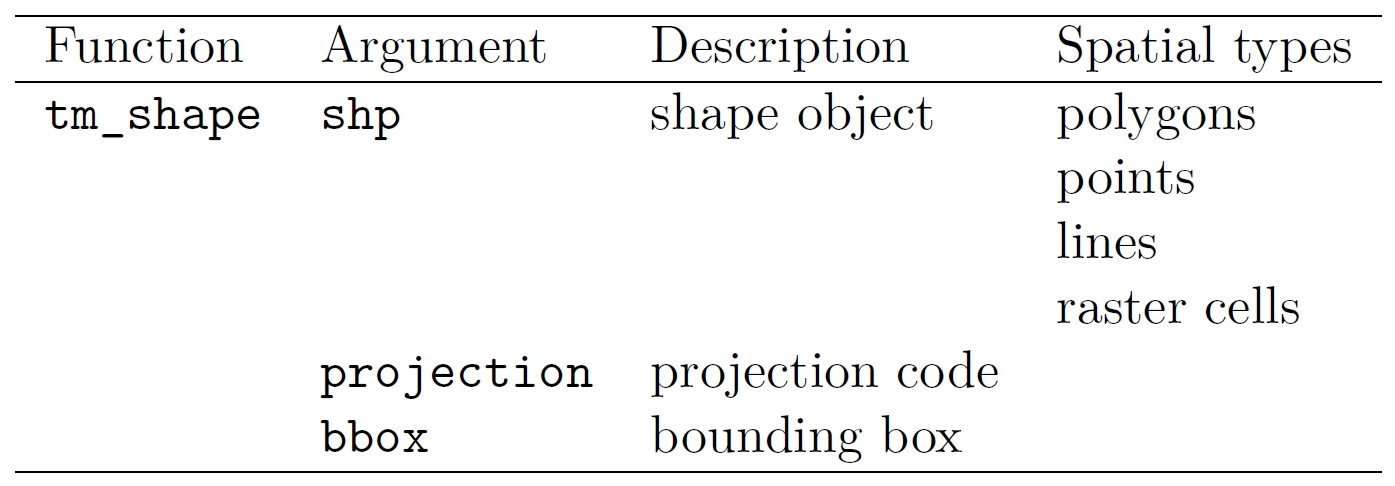
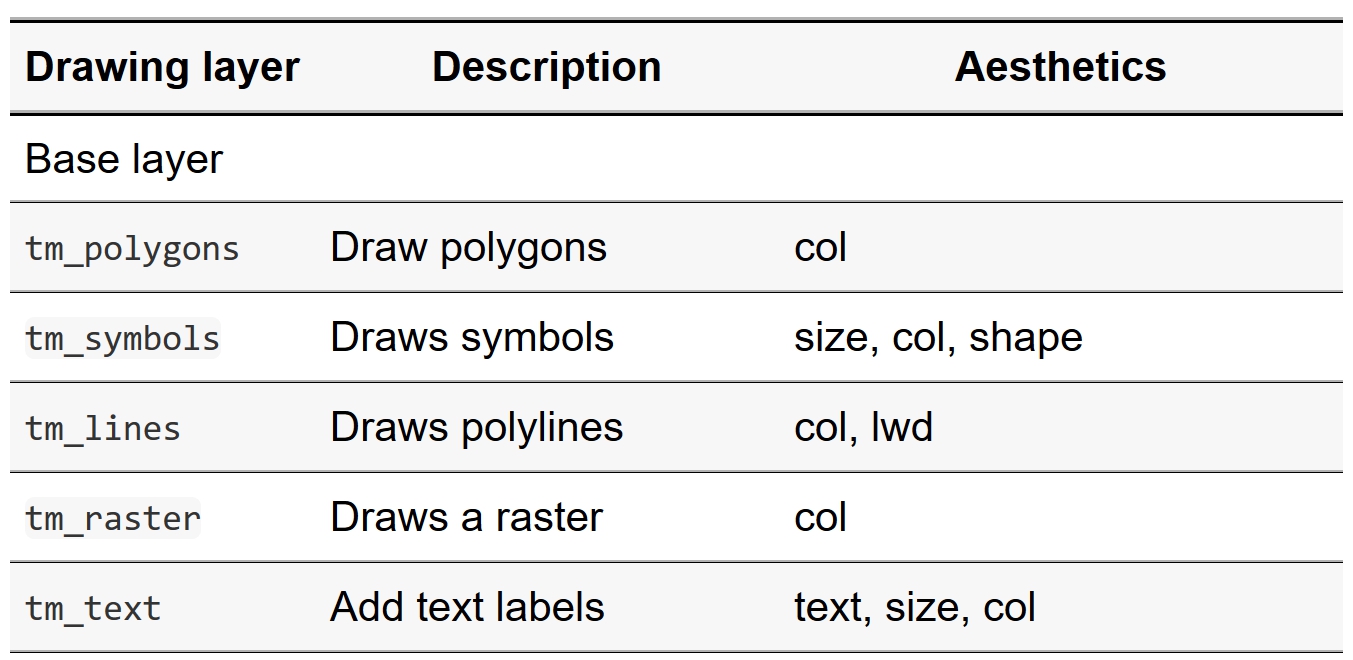
tm_shape()tm_shape(), which specifies the shape object.tm_polygons(), tm_symbols(), tm_lines(), tm_raster() and tm_text()Each aesthetic can take a constant value or a data variable name. For instance, tm_fill(col="blue") colors all polygons blue, while tm_fill(col="var1"), where “var1” is the name of a data variable in the shape object, creates a choropleth.
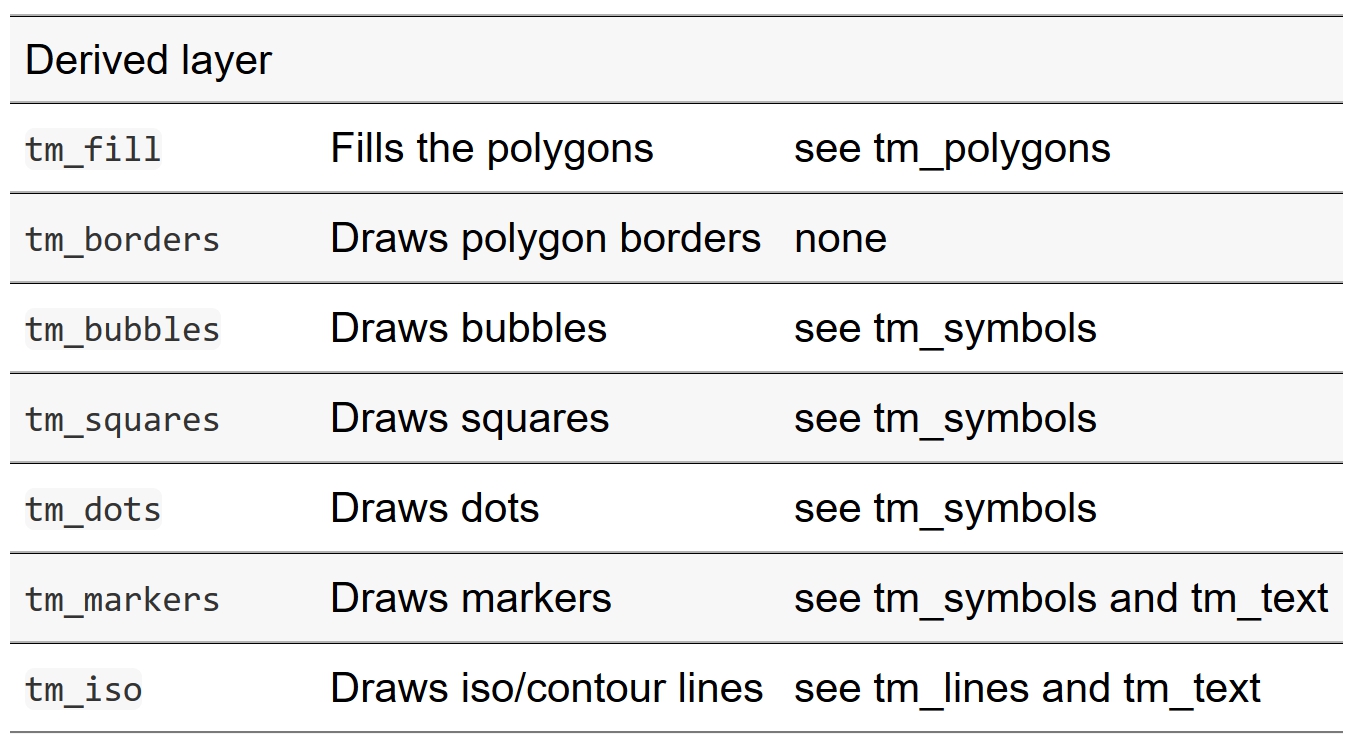
The supported derived layers are as follows:
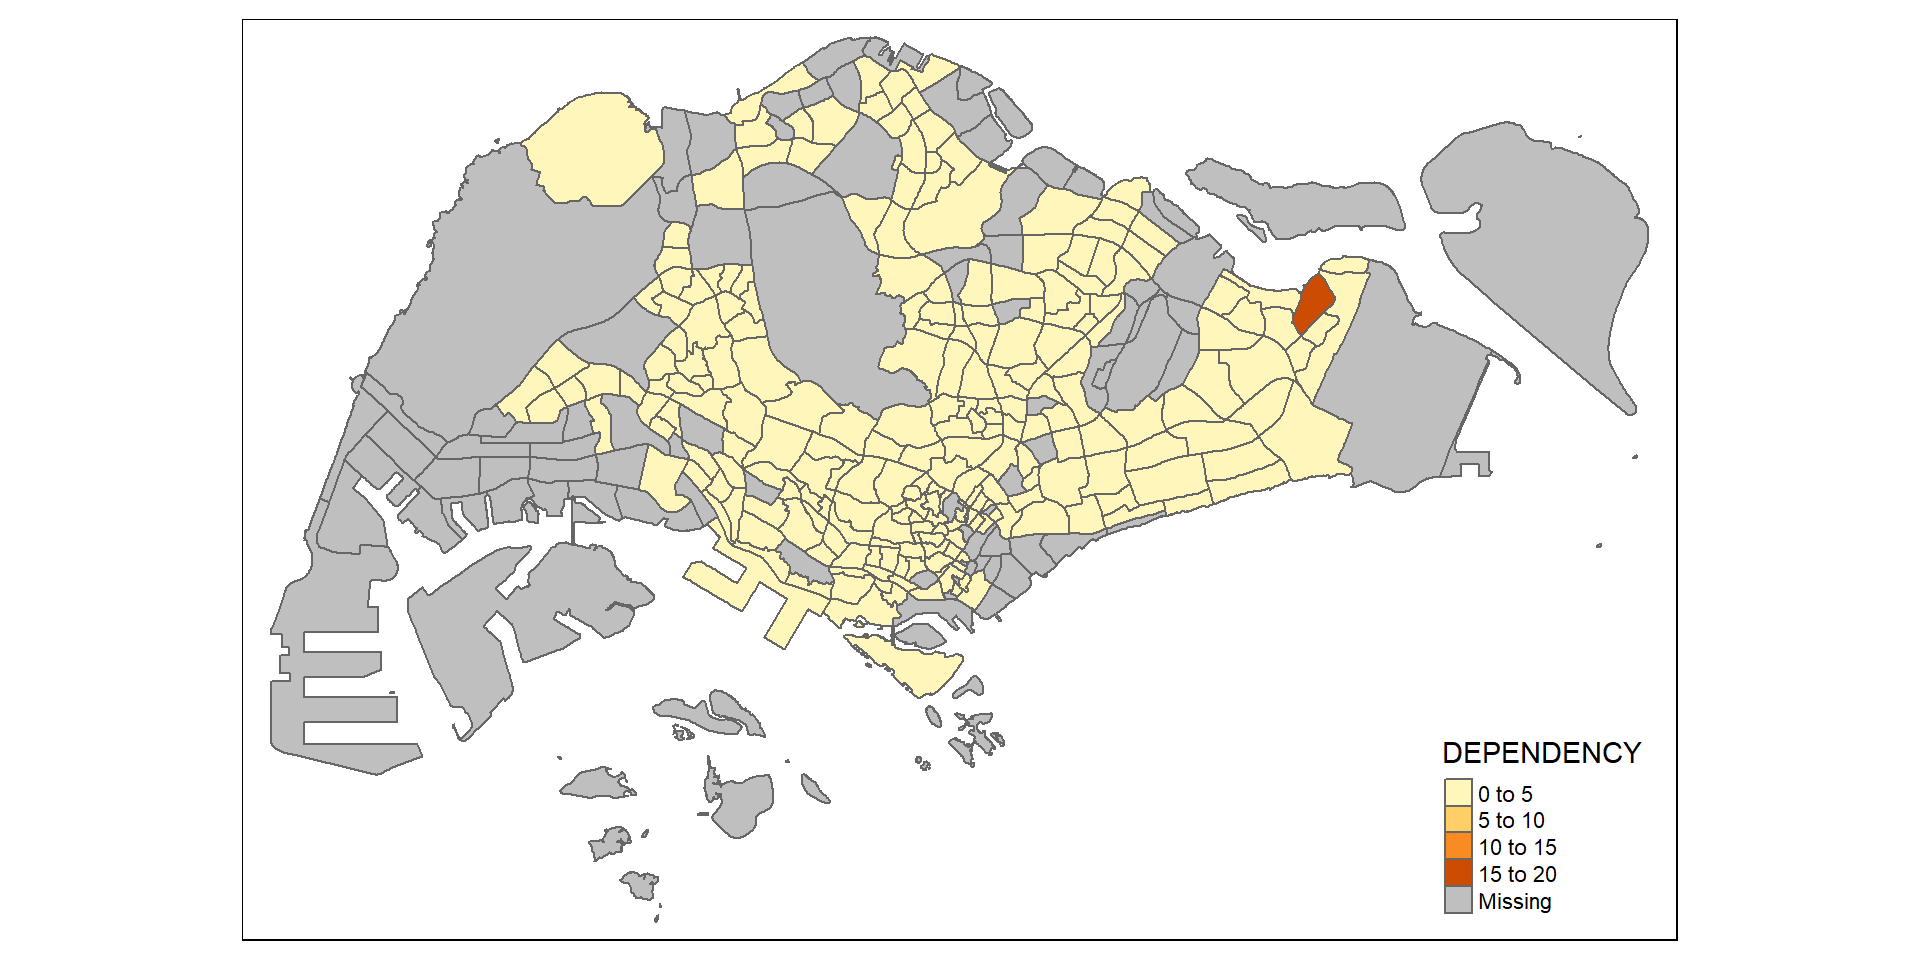
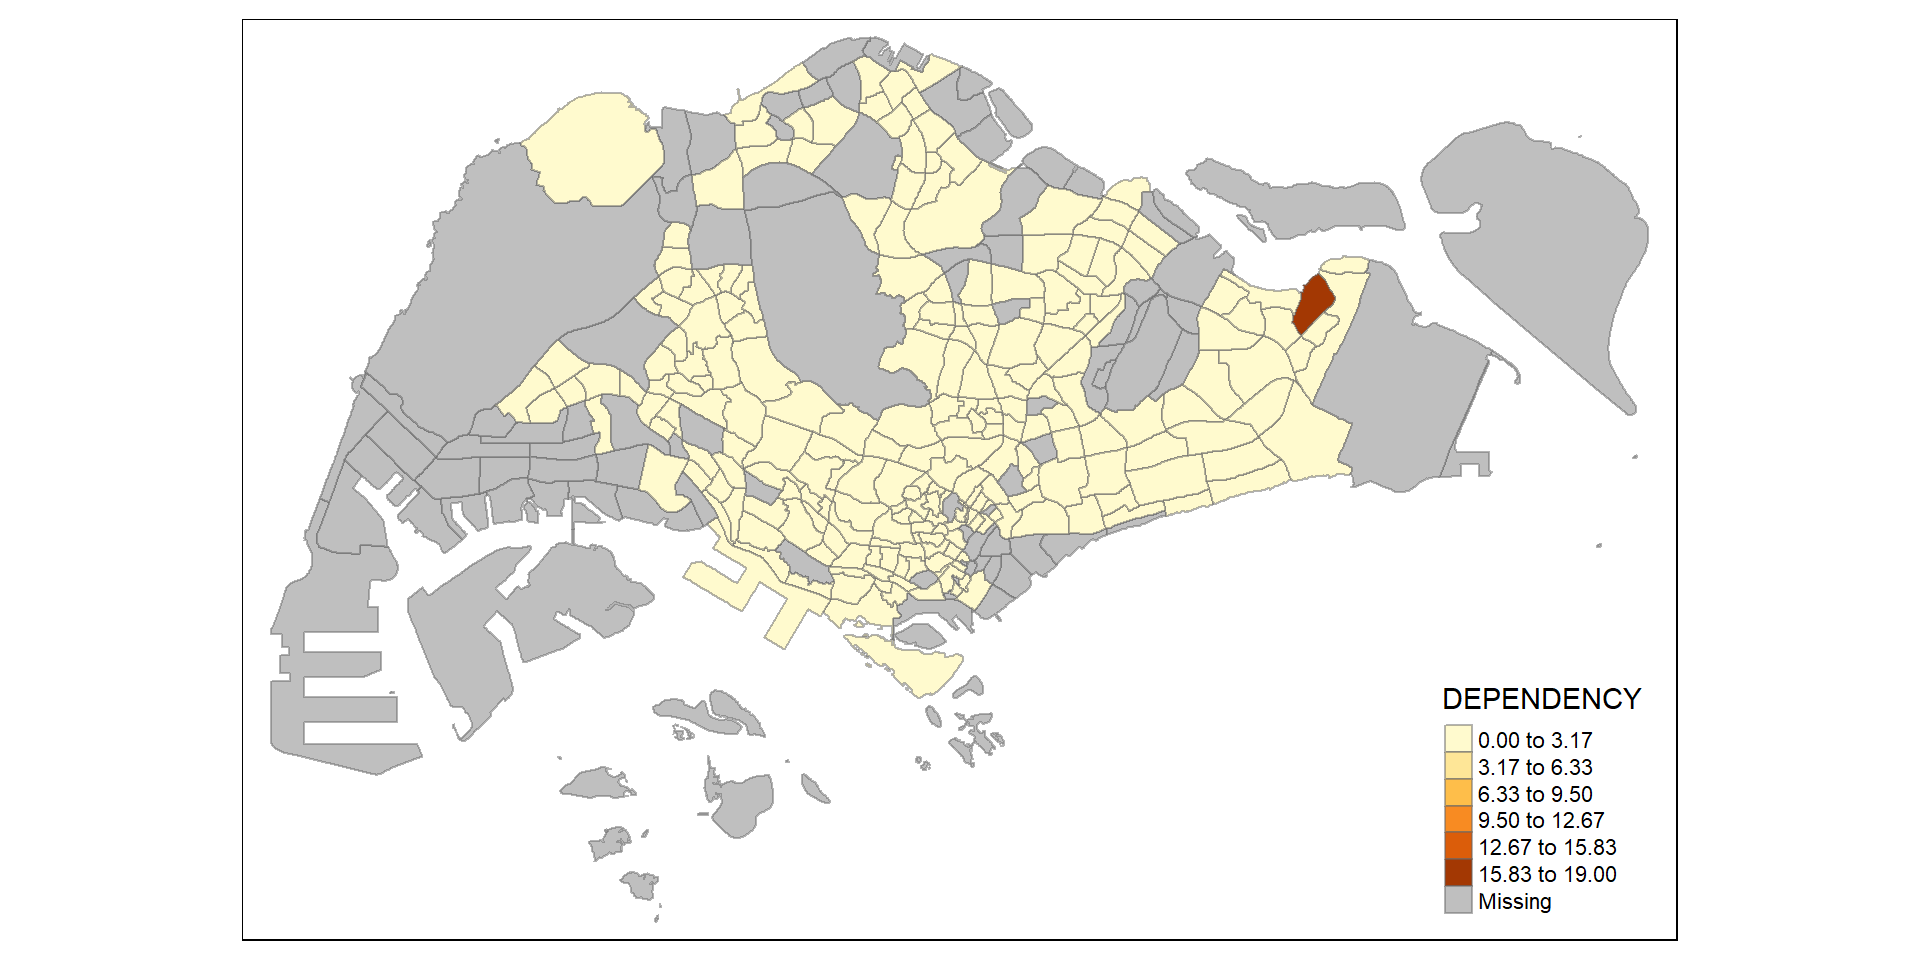
To draw a choropleth map showing the geographical distribution of a selected variable by planning subzone, we just need to assign the target variable such as DEPENDENCY to tm_polygons().
Things to learn from tm_polygons():
tm_fill() and tm_border()Note
tm_polygons() is a wrapper of tm_fill() and tm_border().tm_fill() shades the polygons by using the default colour scheme.tm_borders() adds the borders of the shapefile onto the choropleth map.tm_border()To add the boundary of the planning subzones, tm_border() will be used.
Note
Notice that light-gray border lines have been added on the choropleth map.
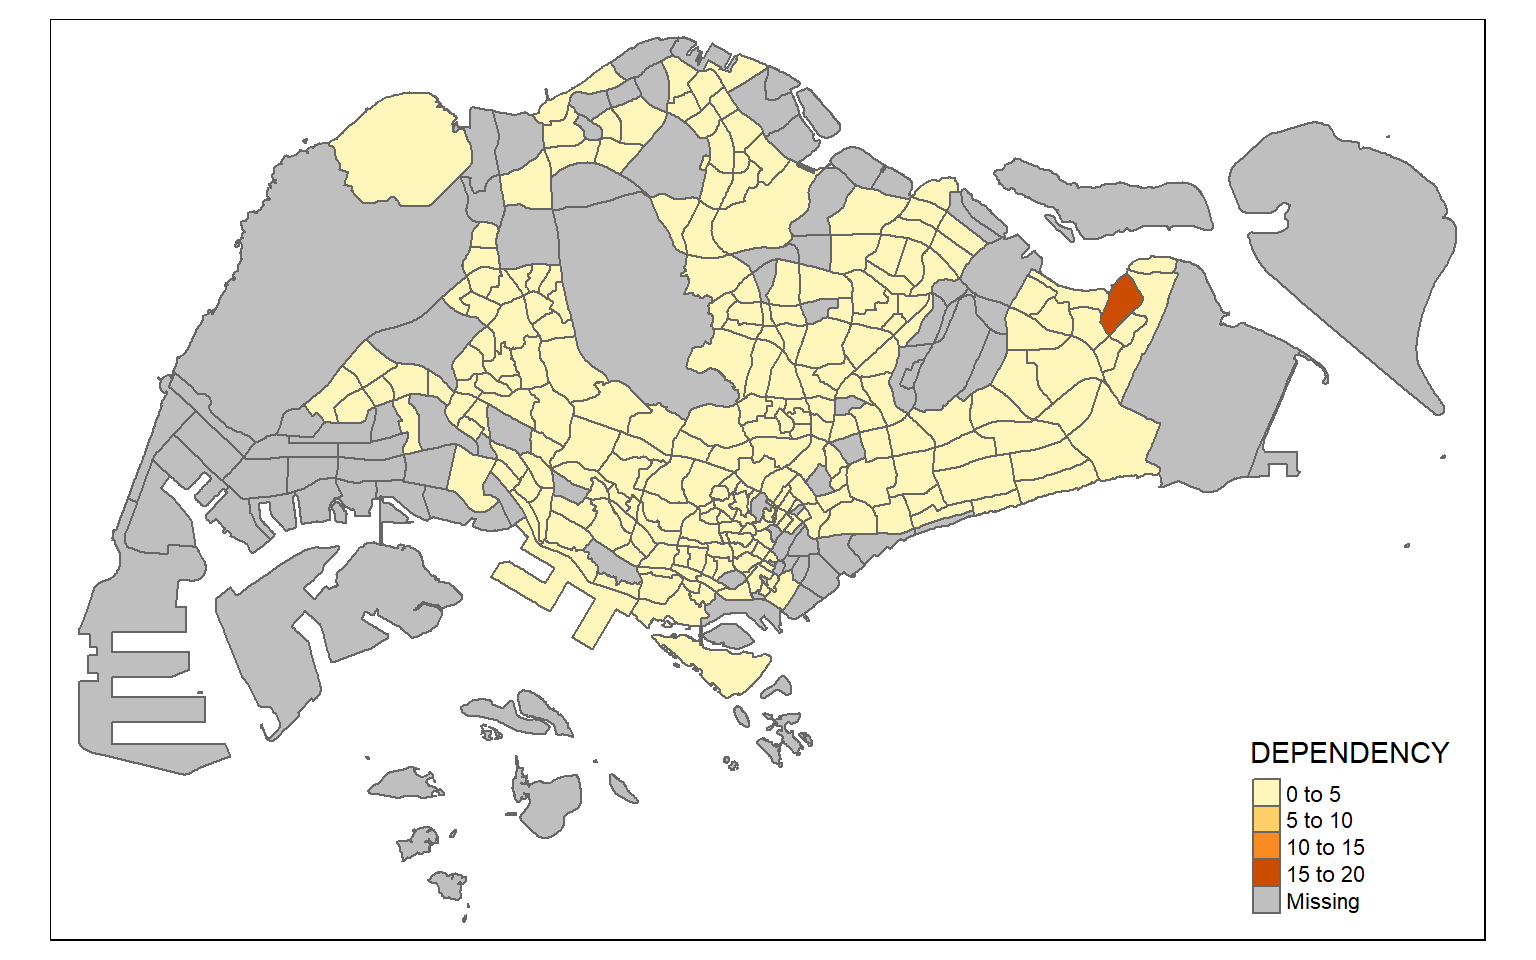
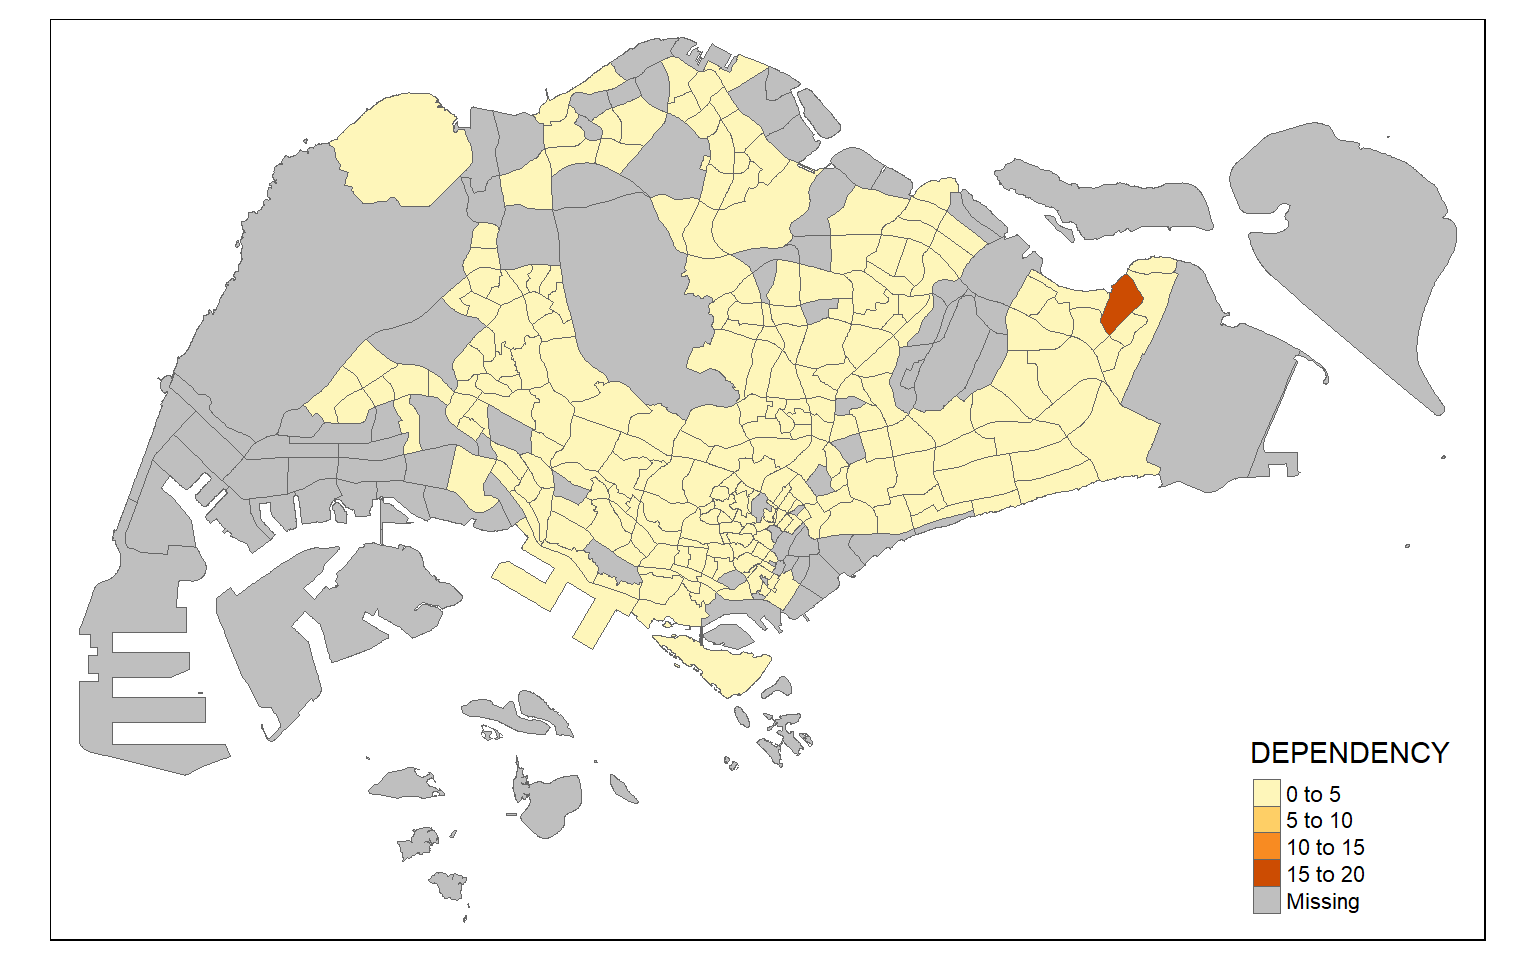
Most choropleth maps employ some method of data classification. The point of classification is to take a large number of observations and group them into data ranges or classes.
Note
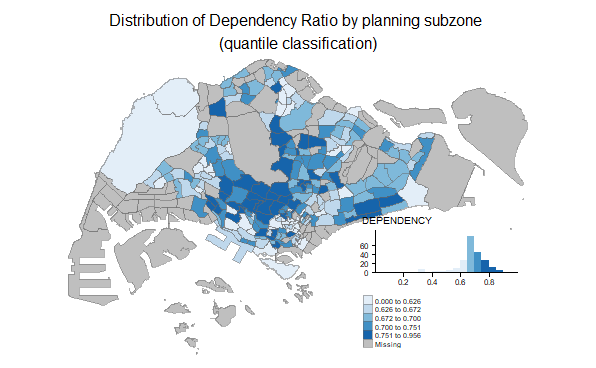
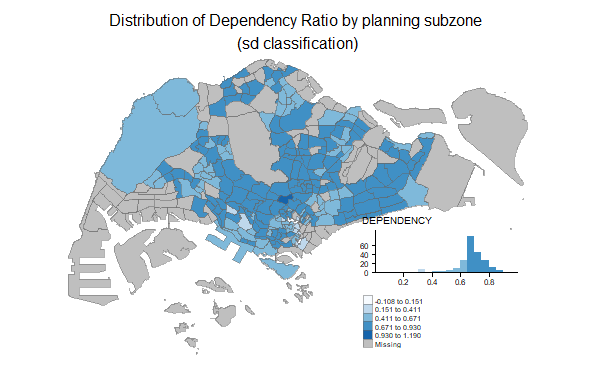
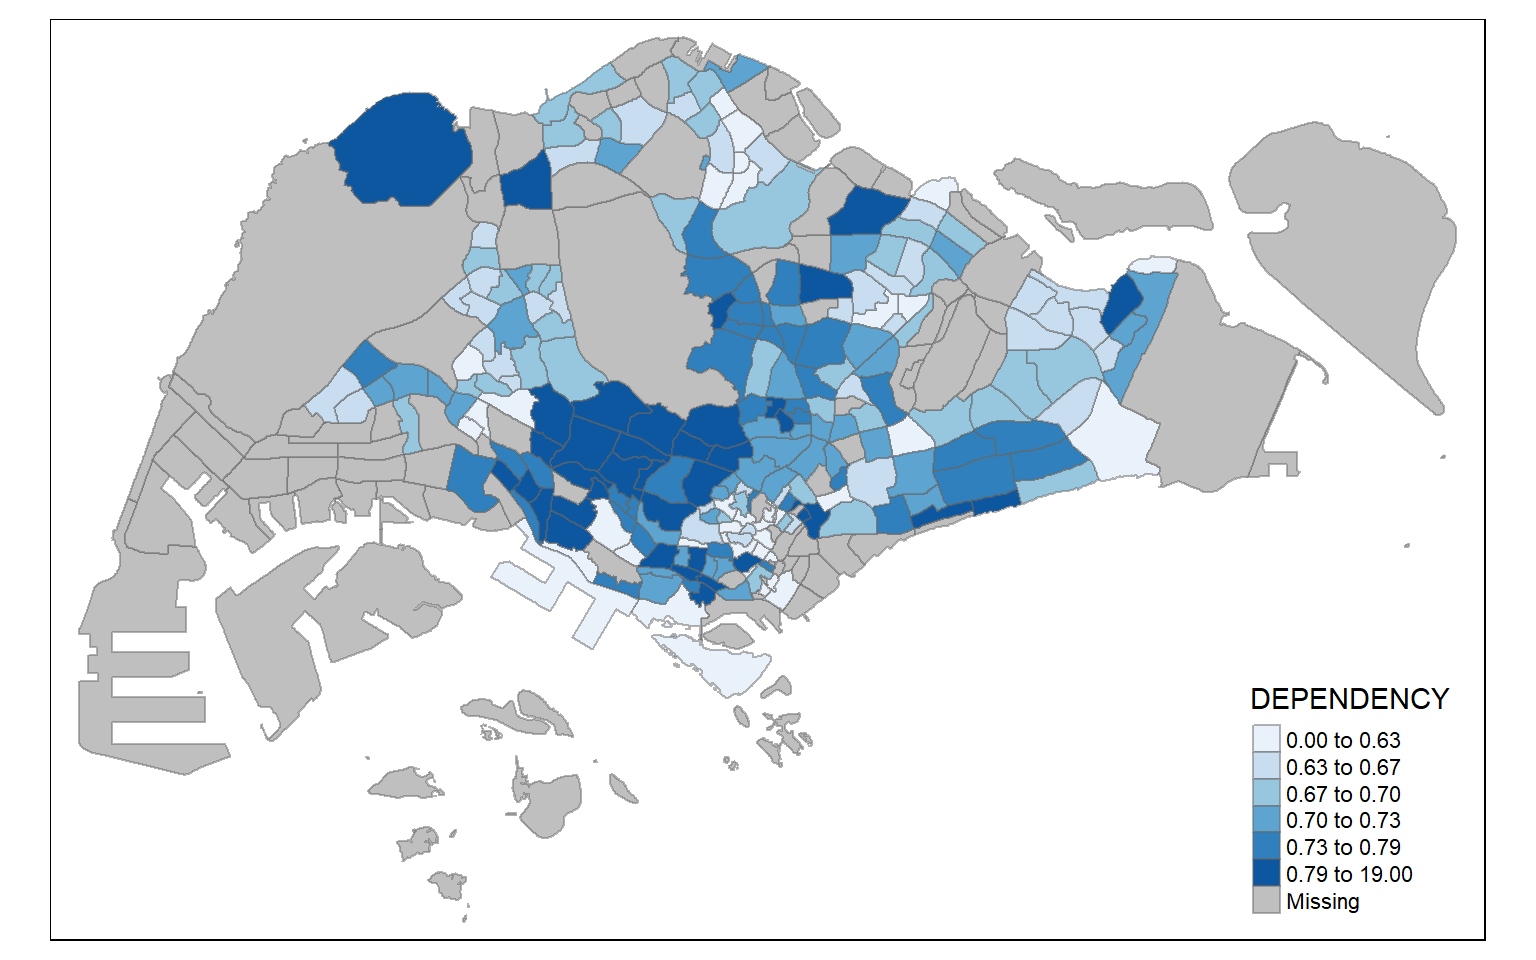
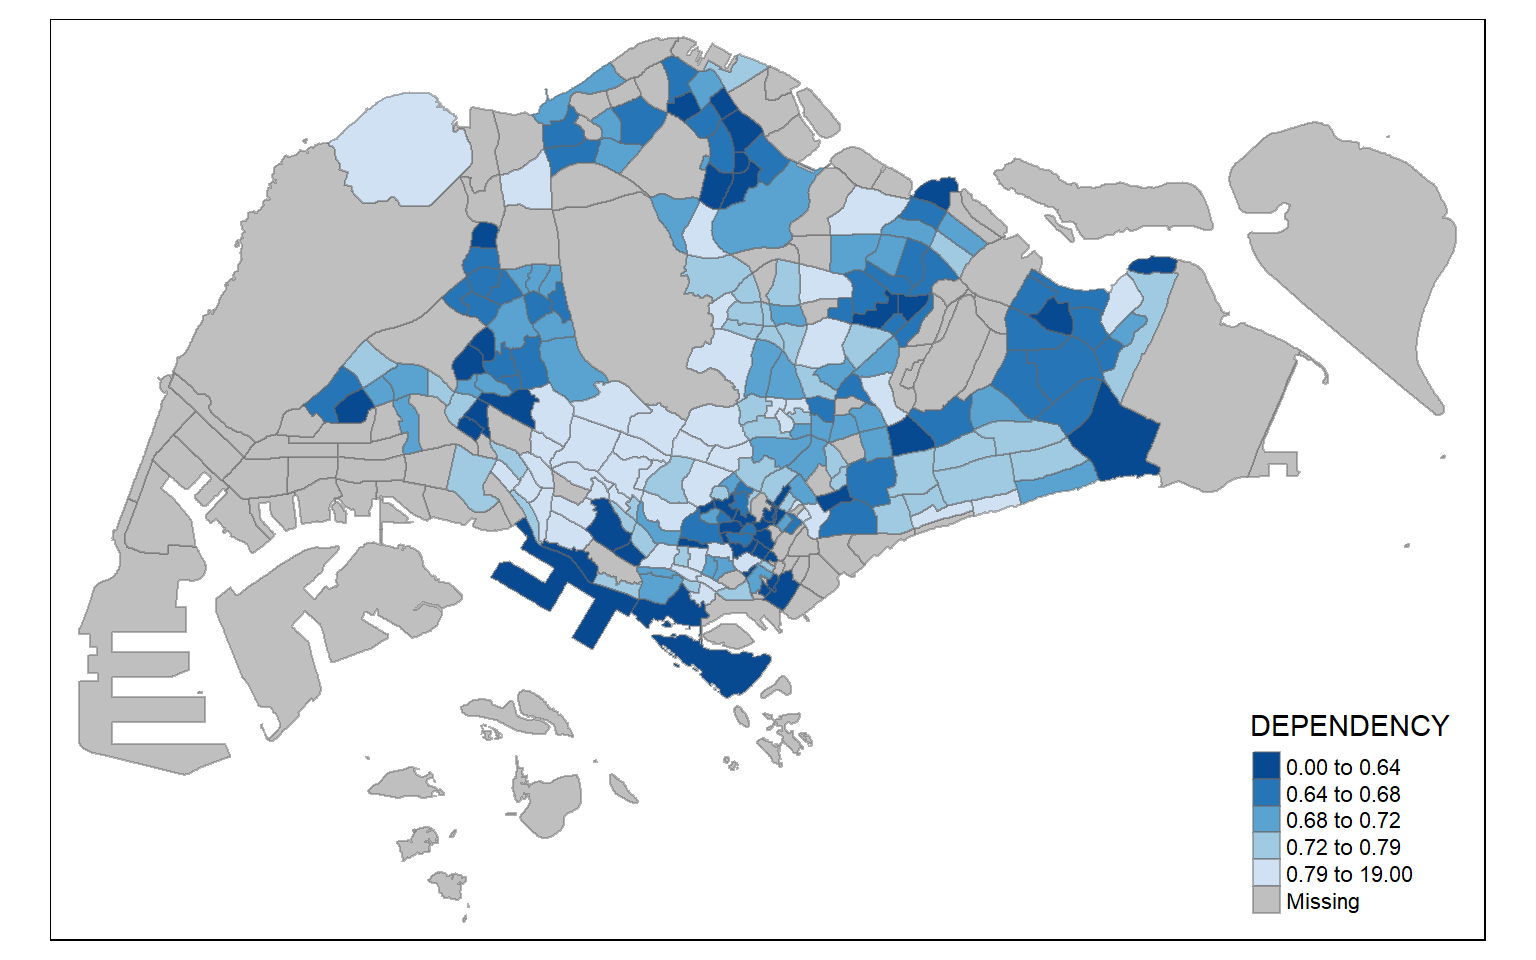
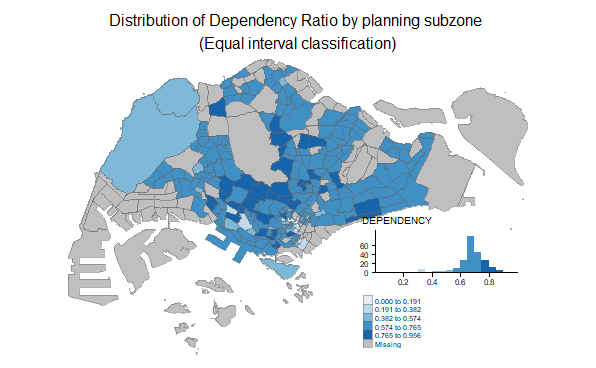
tm_fill() or tm_polygons() will be used.Choropleth maps on the left and right below show quantile and equal data classification methods are used.
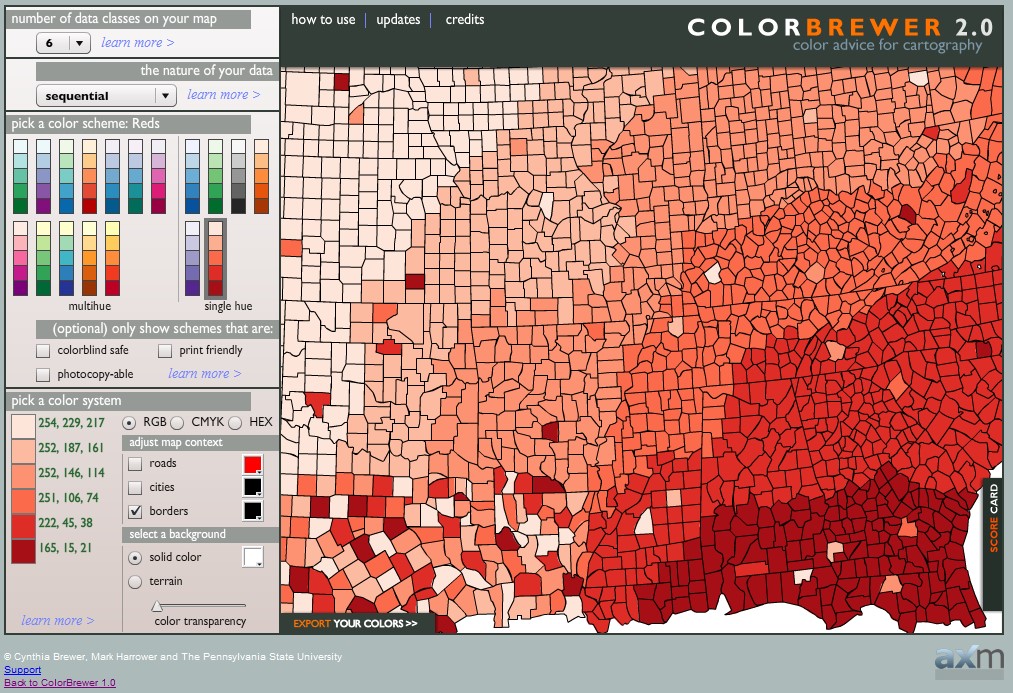
tmap supports colour ramps either defined by the user or a set of predefined colour ramps from the RColorBrewer package.
Note
tm_fill().In tmap, several legend options are provided to change the placement, format and appearance of the legend.
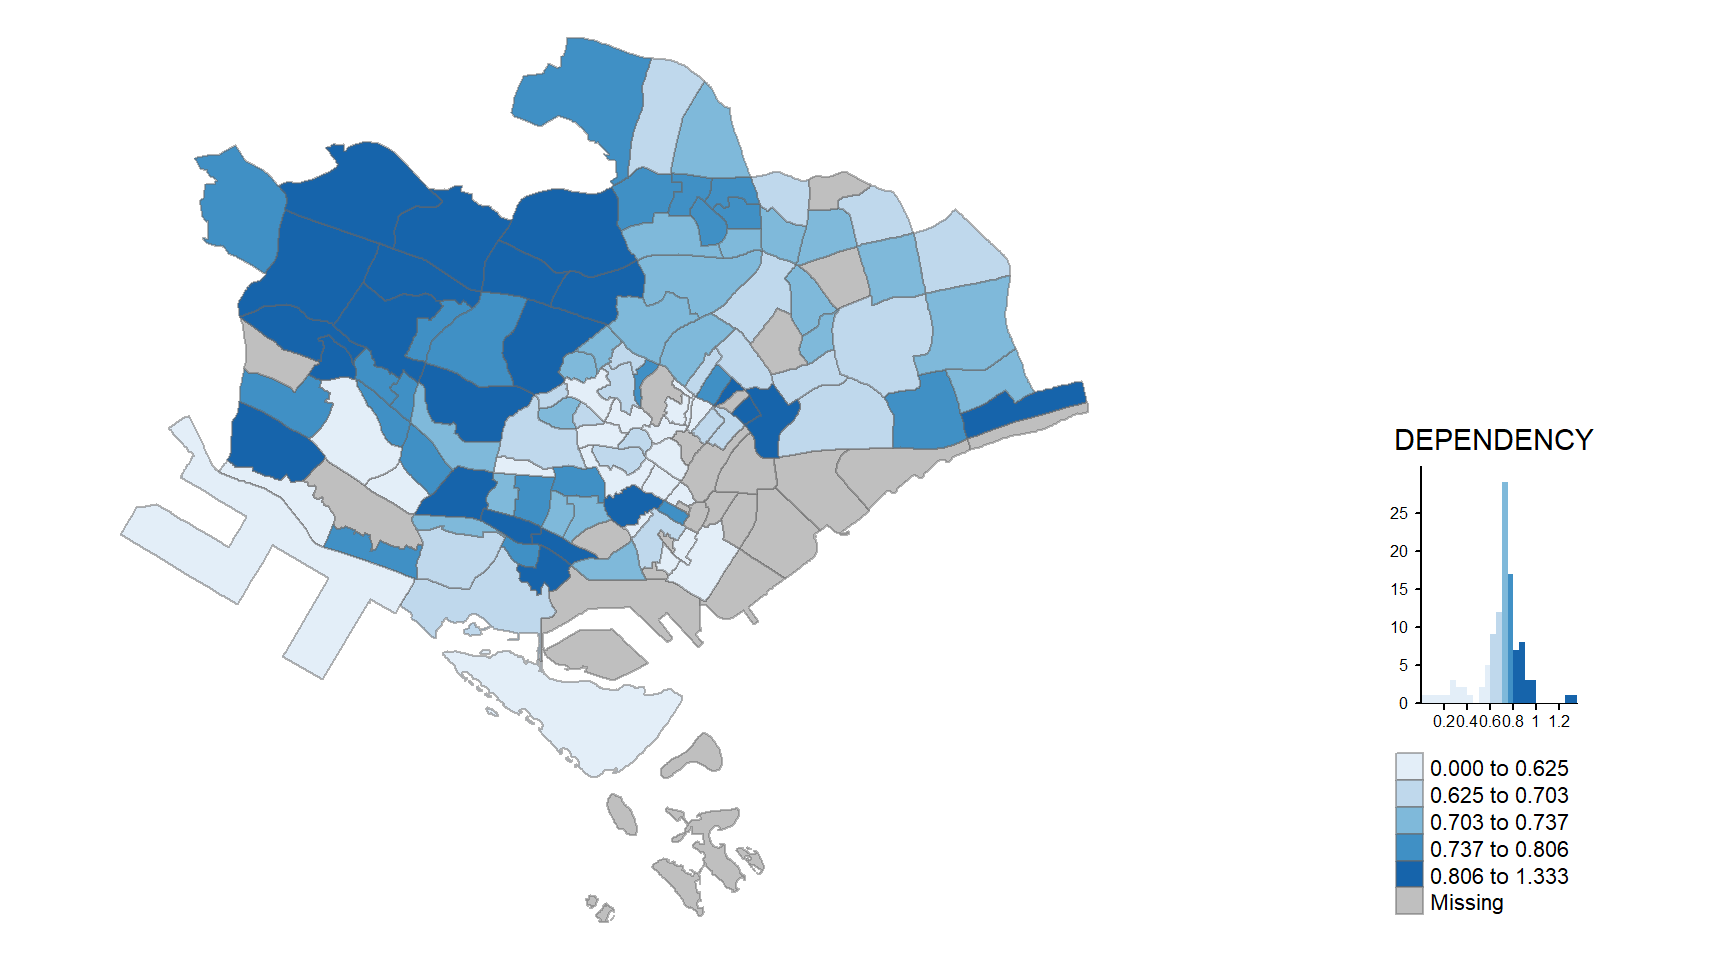
tm_shape(mpszpop2020)+
  tm_fill("DEPENDENCY",
          style = "jenks",
          palette = "Blues",
          legend.hist = TRUE,
          legend.is.portrait = TRUE,
          legend.hist.z = 0.1) +
  tm_layout(main.title = "Distribution of Dependency Ratio by planning subzone \n(Jenks classification)",
            main.title.position = "center",
            main.title.size = 1,
            legend.height = 0.45,
            legend.width = 0.35,
            legend.outside = FALSE,
            legend.position = c("right", "bottom"),
            frame = FALSE) +
  tm_borders(alpha = 0.5)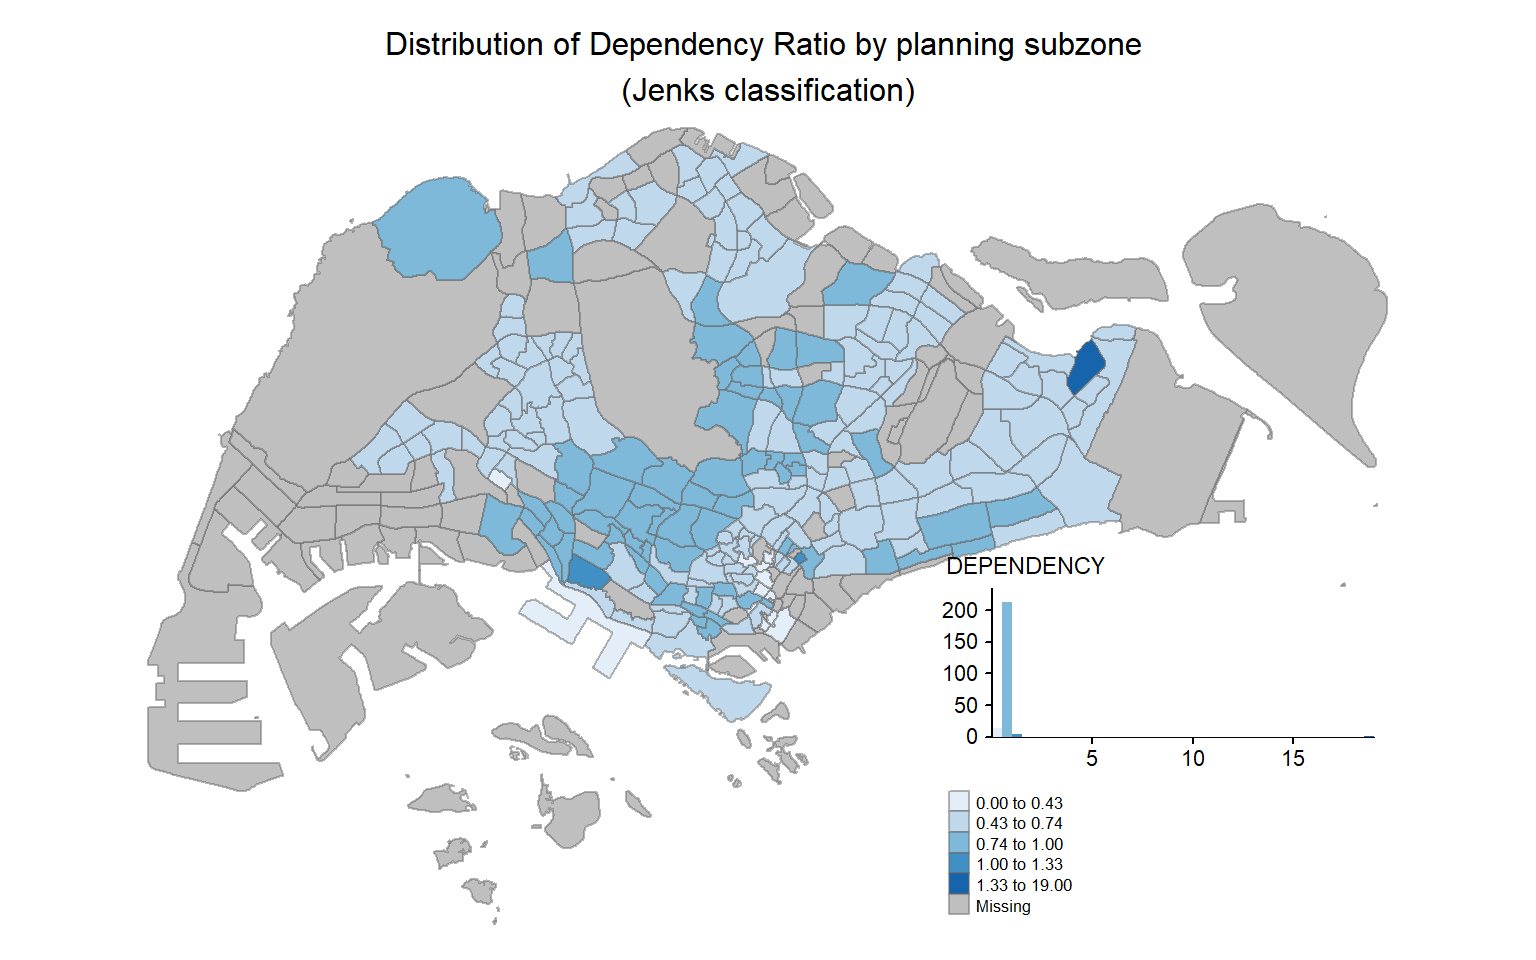
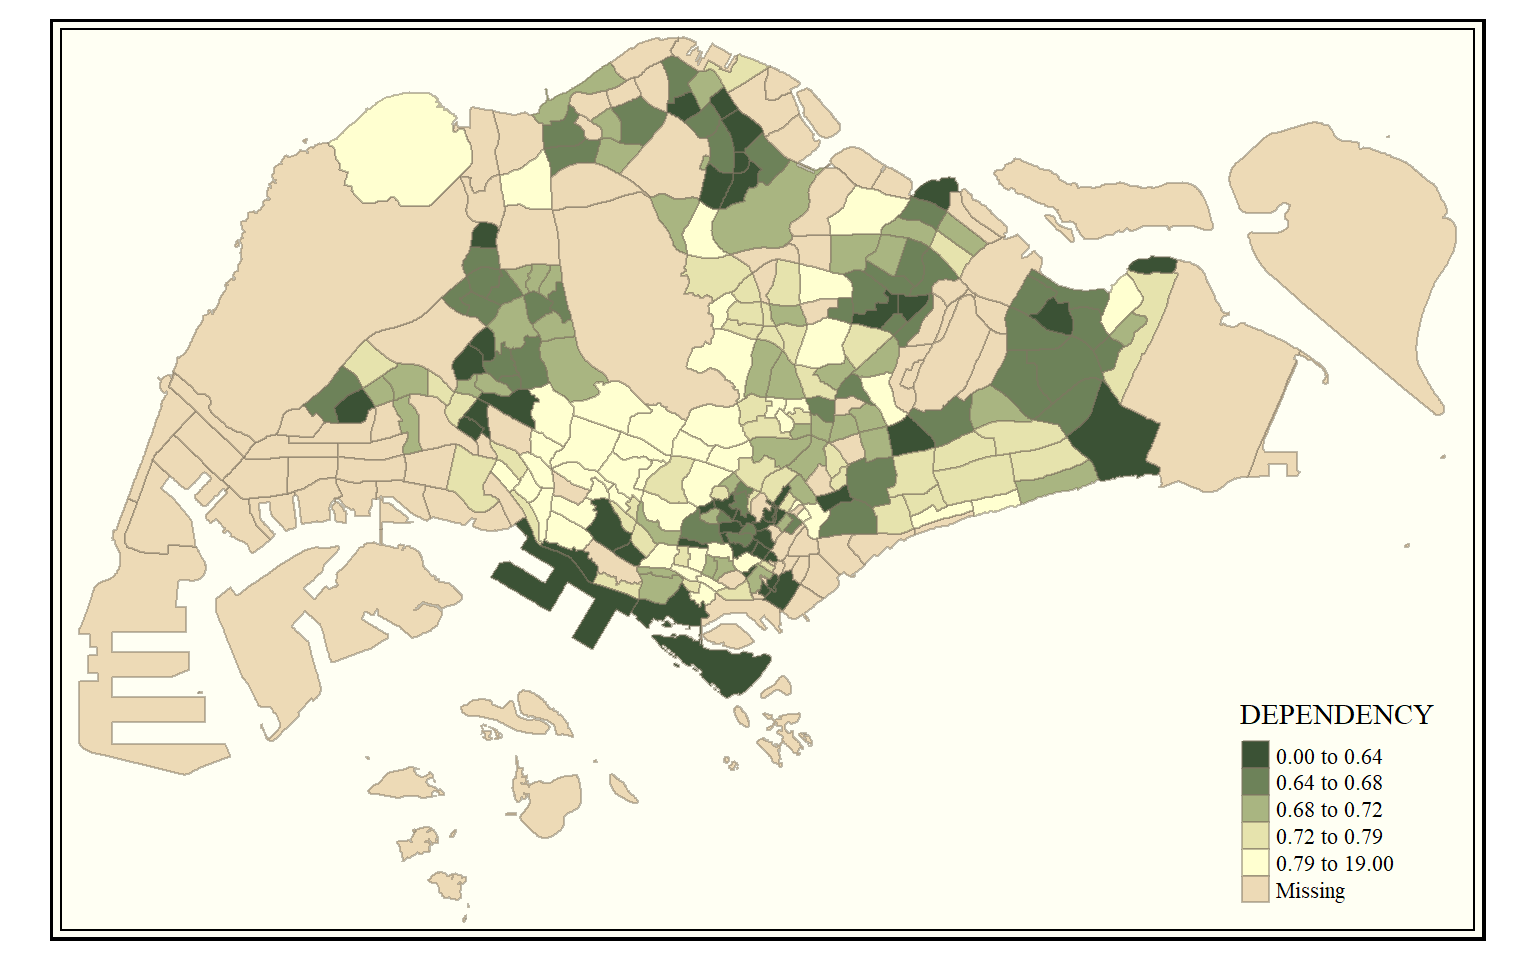
tmap allows a wide variety of layout settings to be changed. They can be called by using tmap_style().
Note
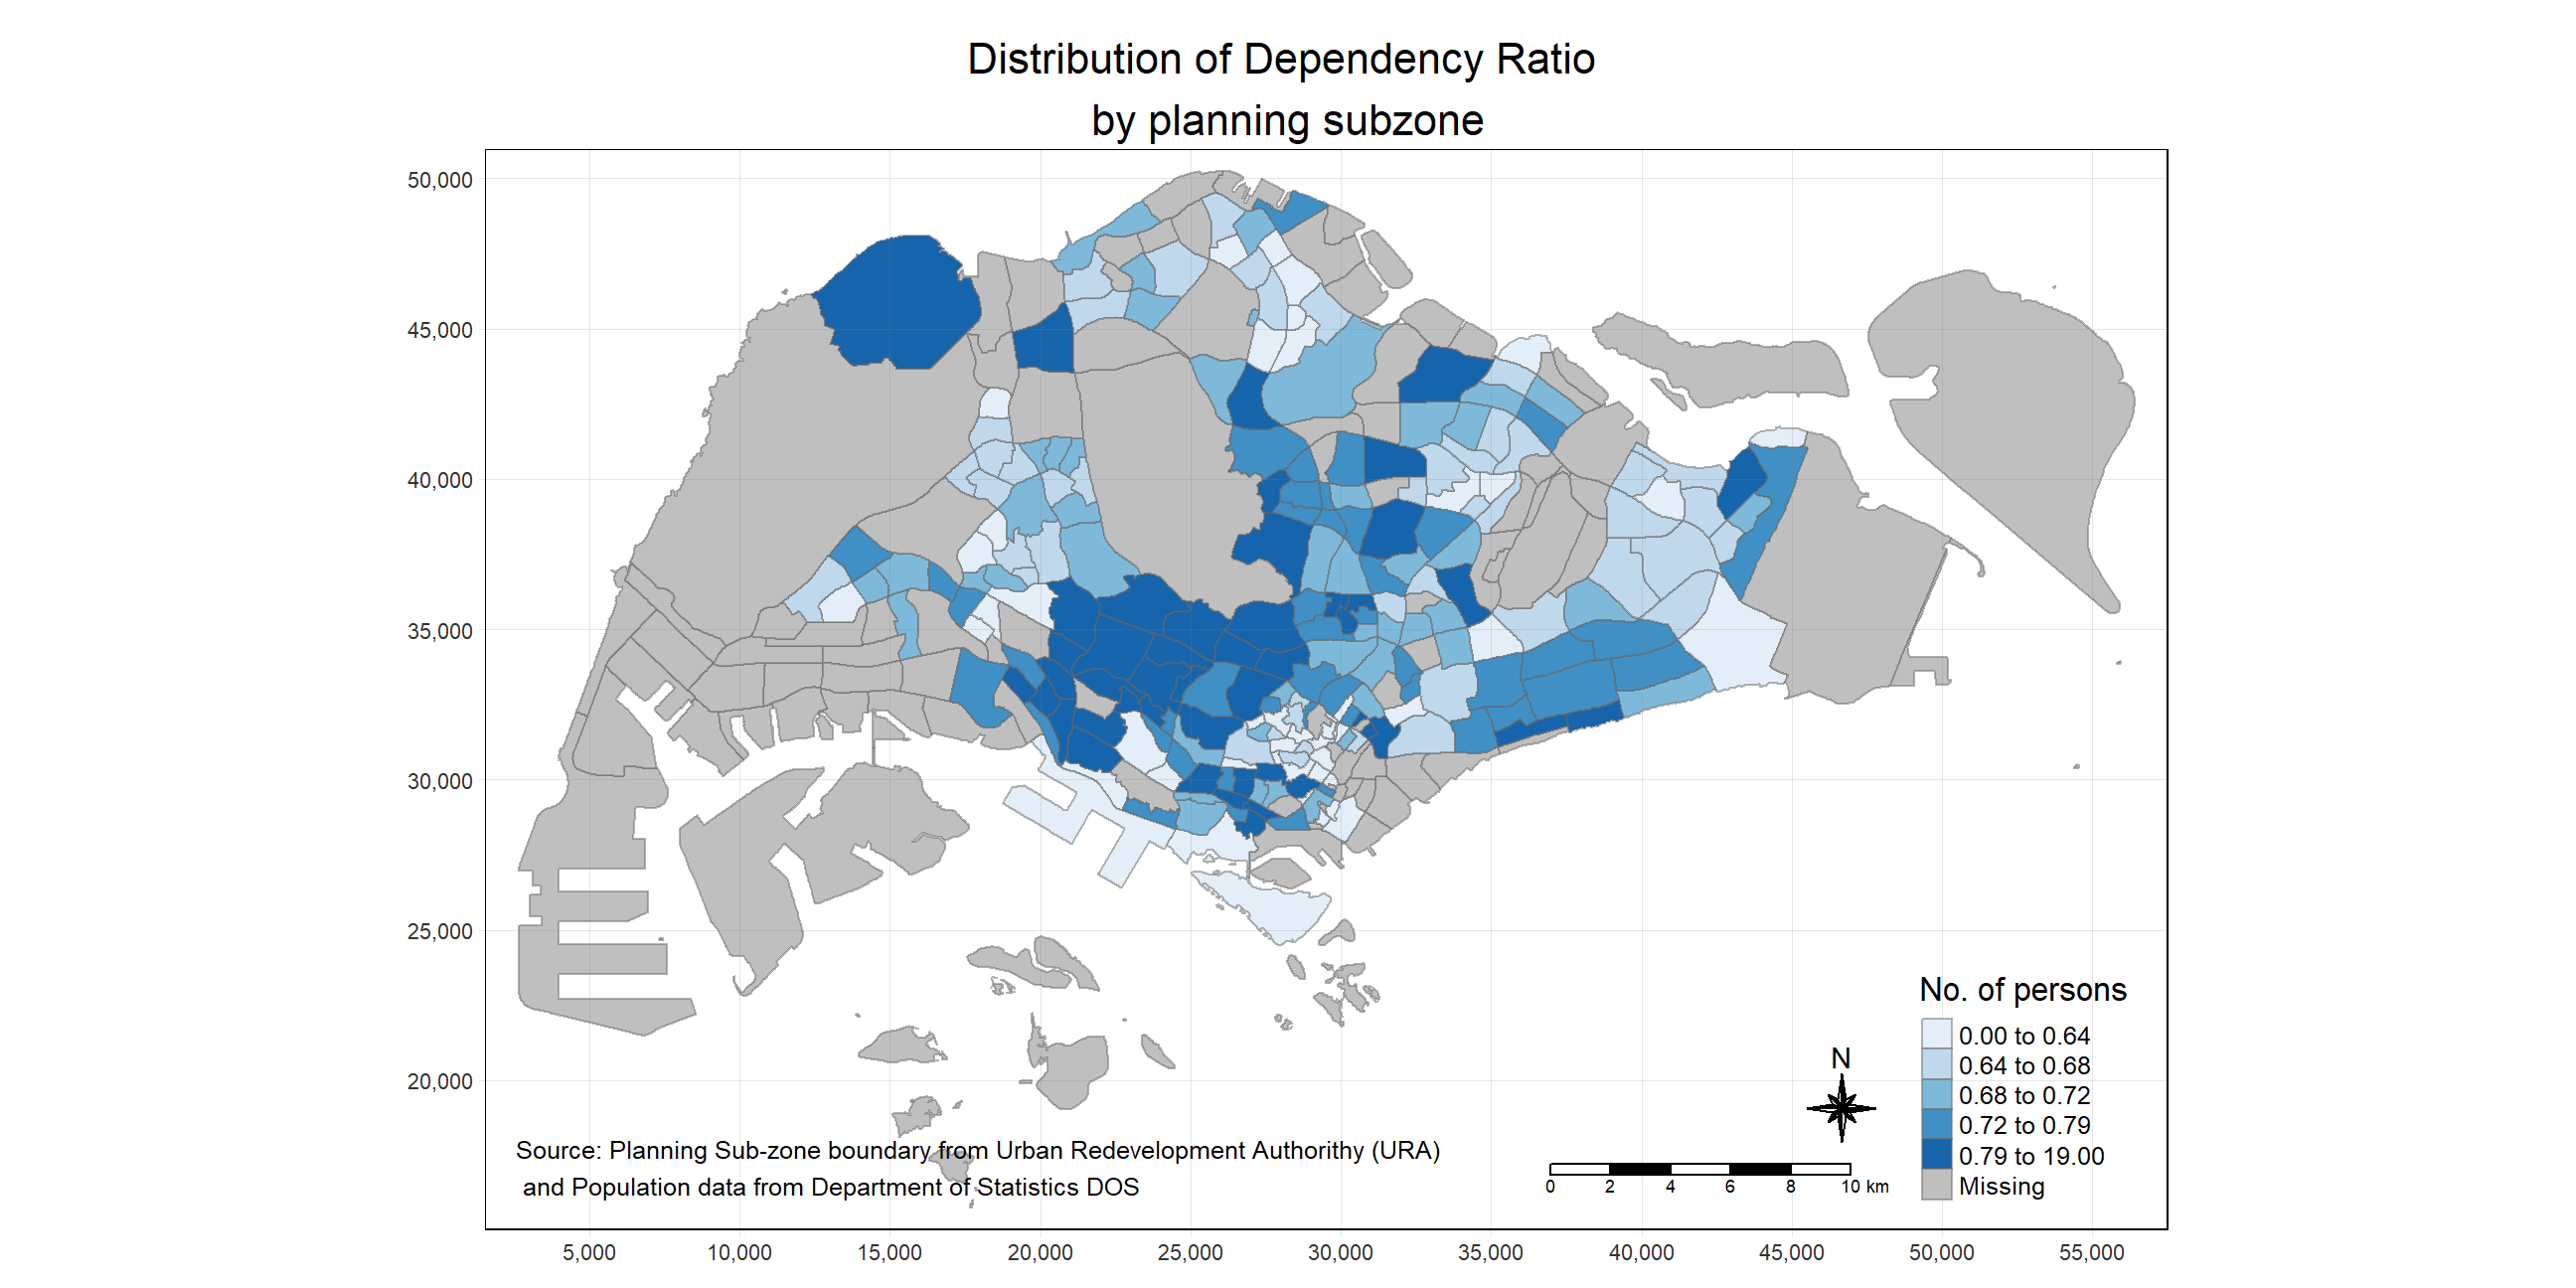
Beside map style, tmap also also provides arguments to draw other map furniture such as compass, scale bar and grid lines. In the choropleth below, tm_compass(), tm_scale_bar() and tm_grid() are used to add compass, scale bar and grid lines onto the choropleth map.
tm_shape(mpszpop2020)+
  tm_fill("DEPENDENCY",
          style = "quantile",
          palette = "Blues",
          title = "No. of persons") +
  tm_layout(main.title = "Distribution of Dependency Ratio \nby planning subzone",
            main.title.position = "center",
            main.title.size = 1.2,
            legend.height = 0.45,
            legend.width = 0.35,
            frame = TRUE) +
  tm_borders(alpha = 0.5) +
  tm_compass(type="8star", size = 2) +
  tm_scale_bar(width = 0.15) +
  tm_grid(lwd = 0.1, alpha = 0.2) +
  tm_credits("Source: Planning Sub-zone boundary from Urban Redevelopment Authorithy (URA)\n and Population data from Department of Statistics DOS",
             position = c("left", "bottom"))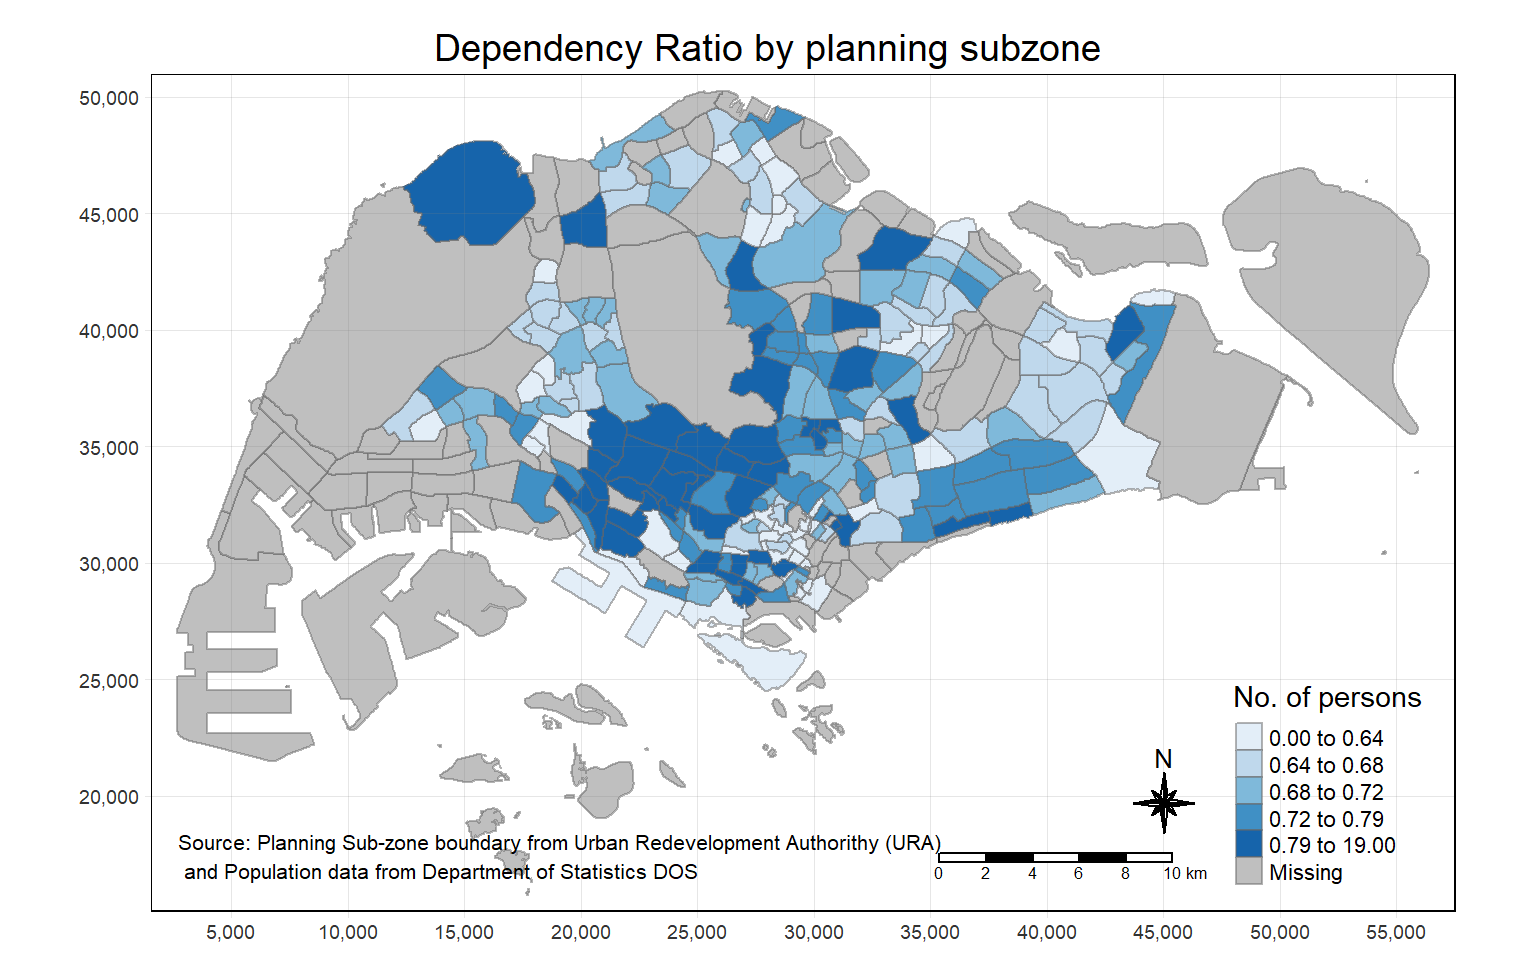
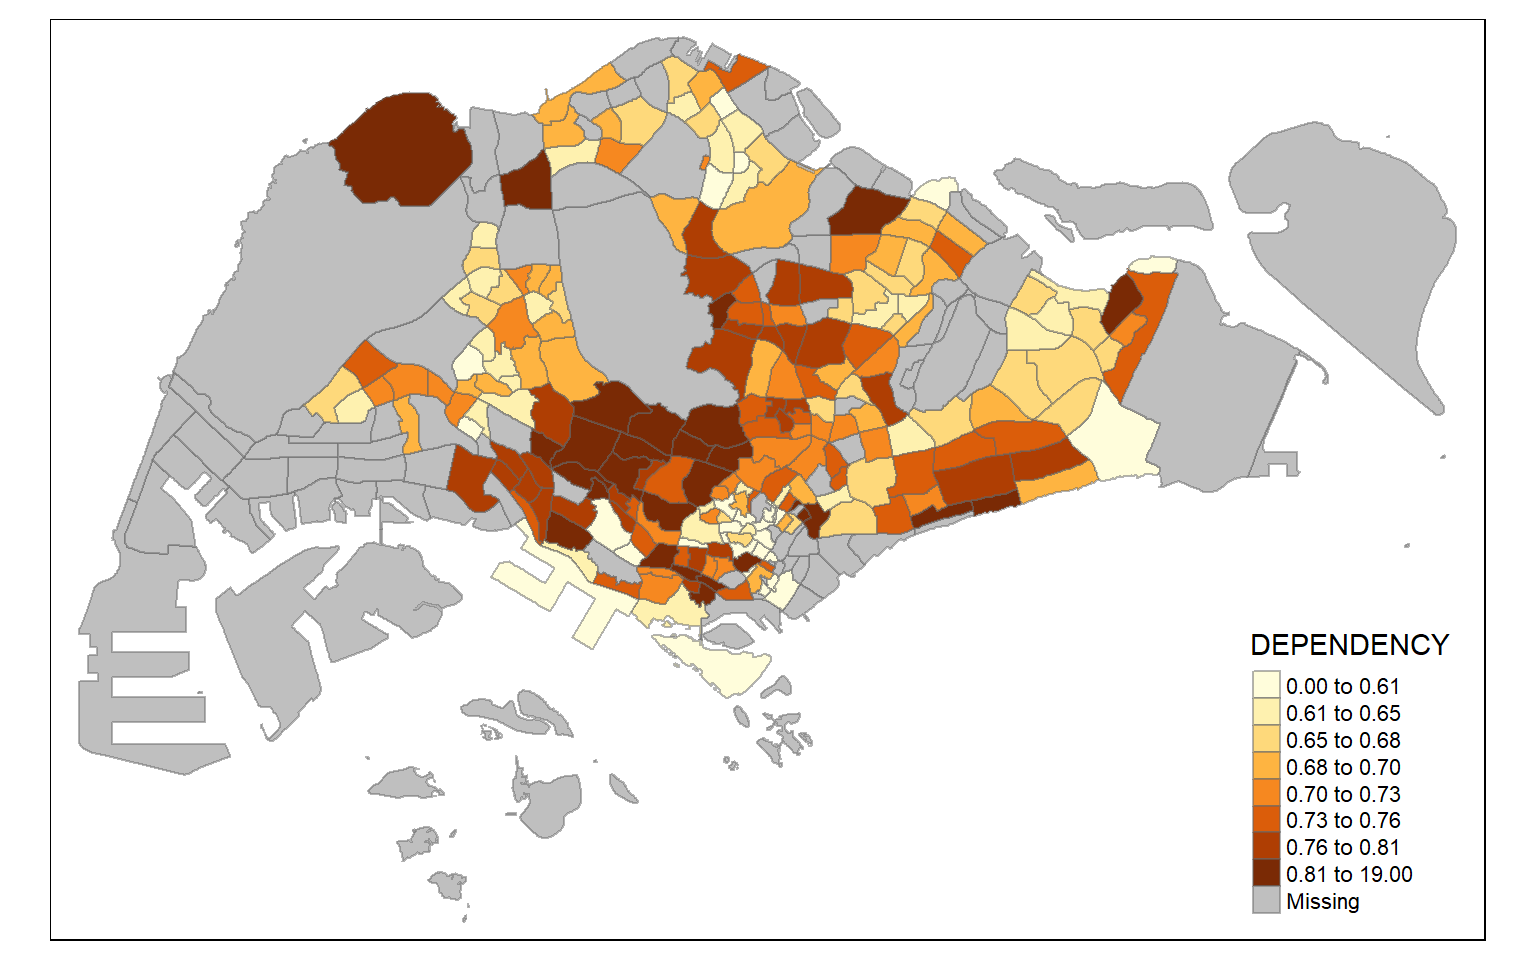
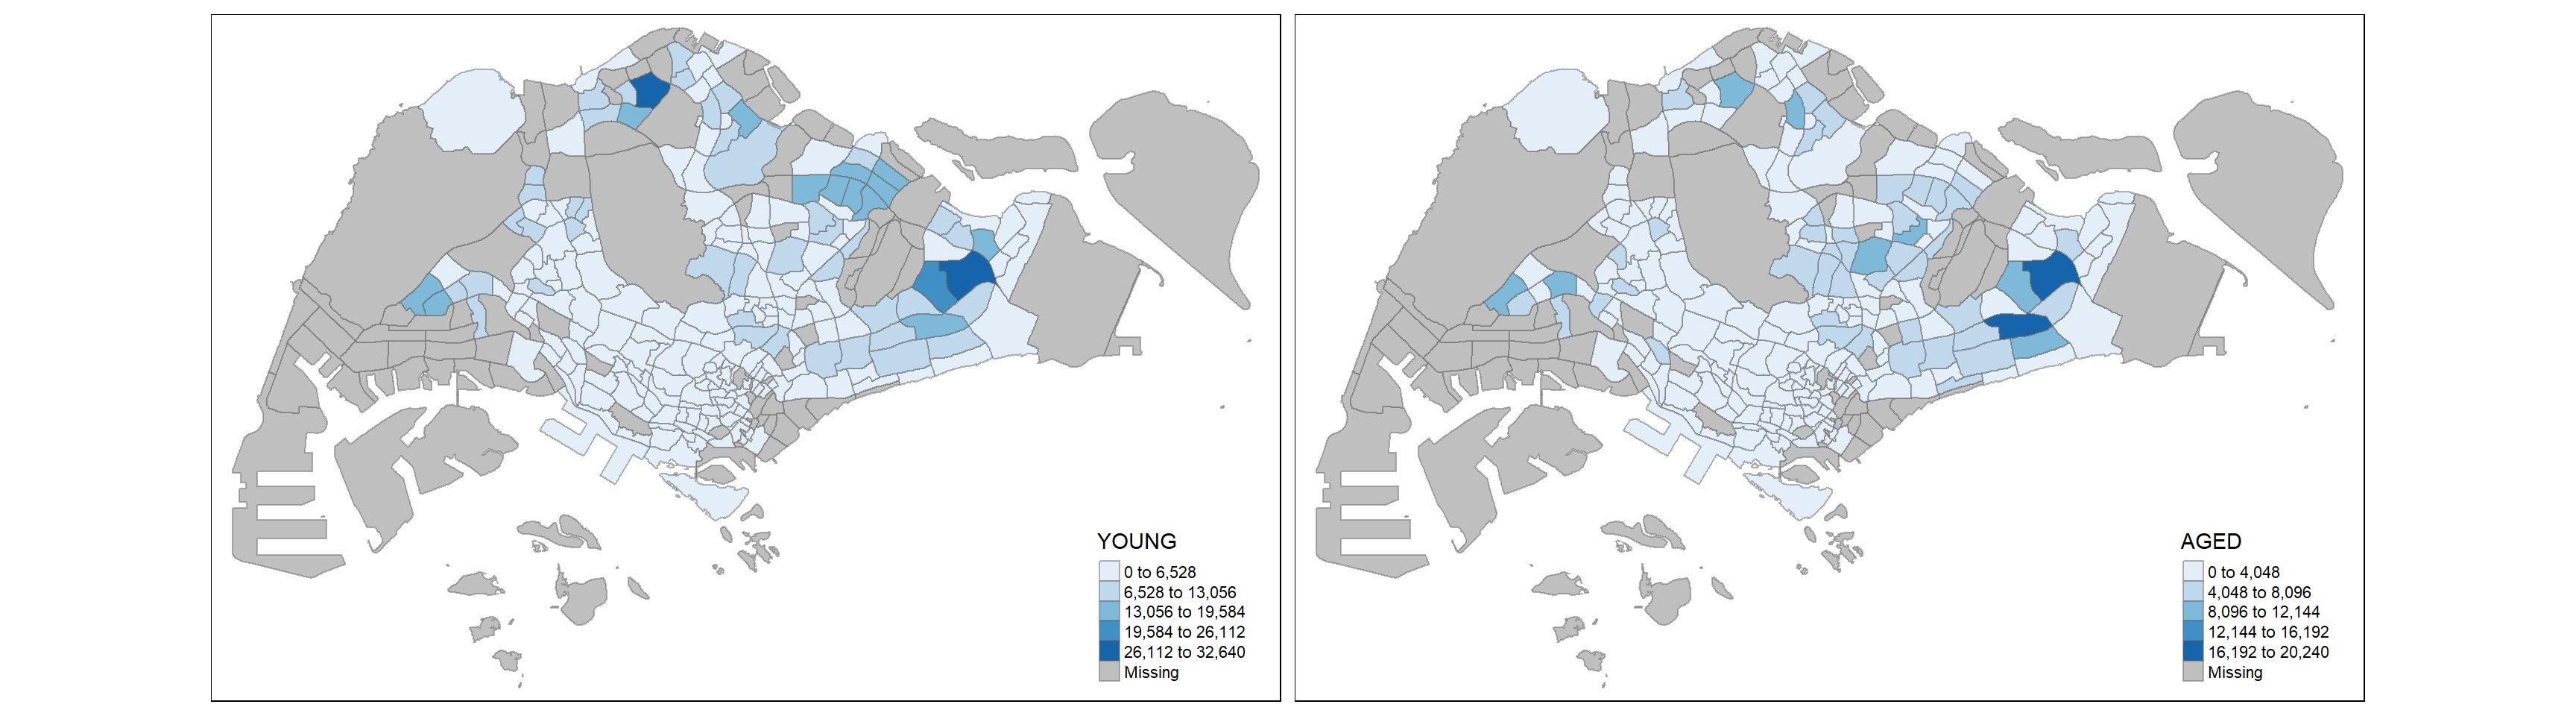
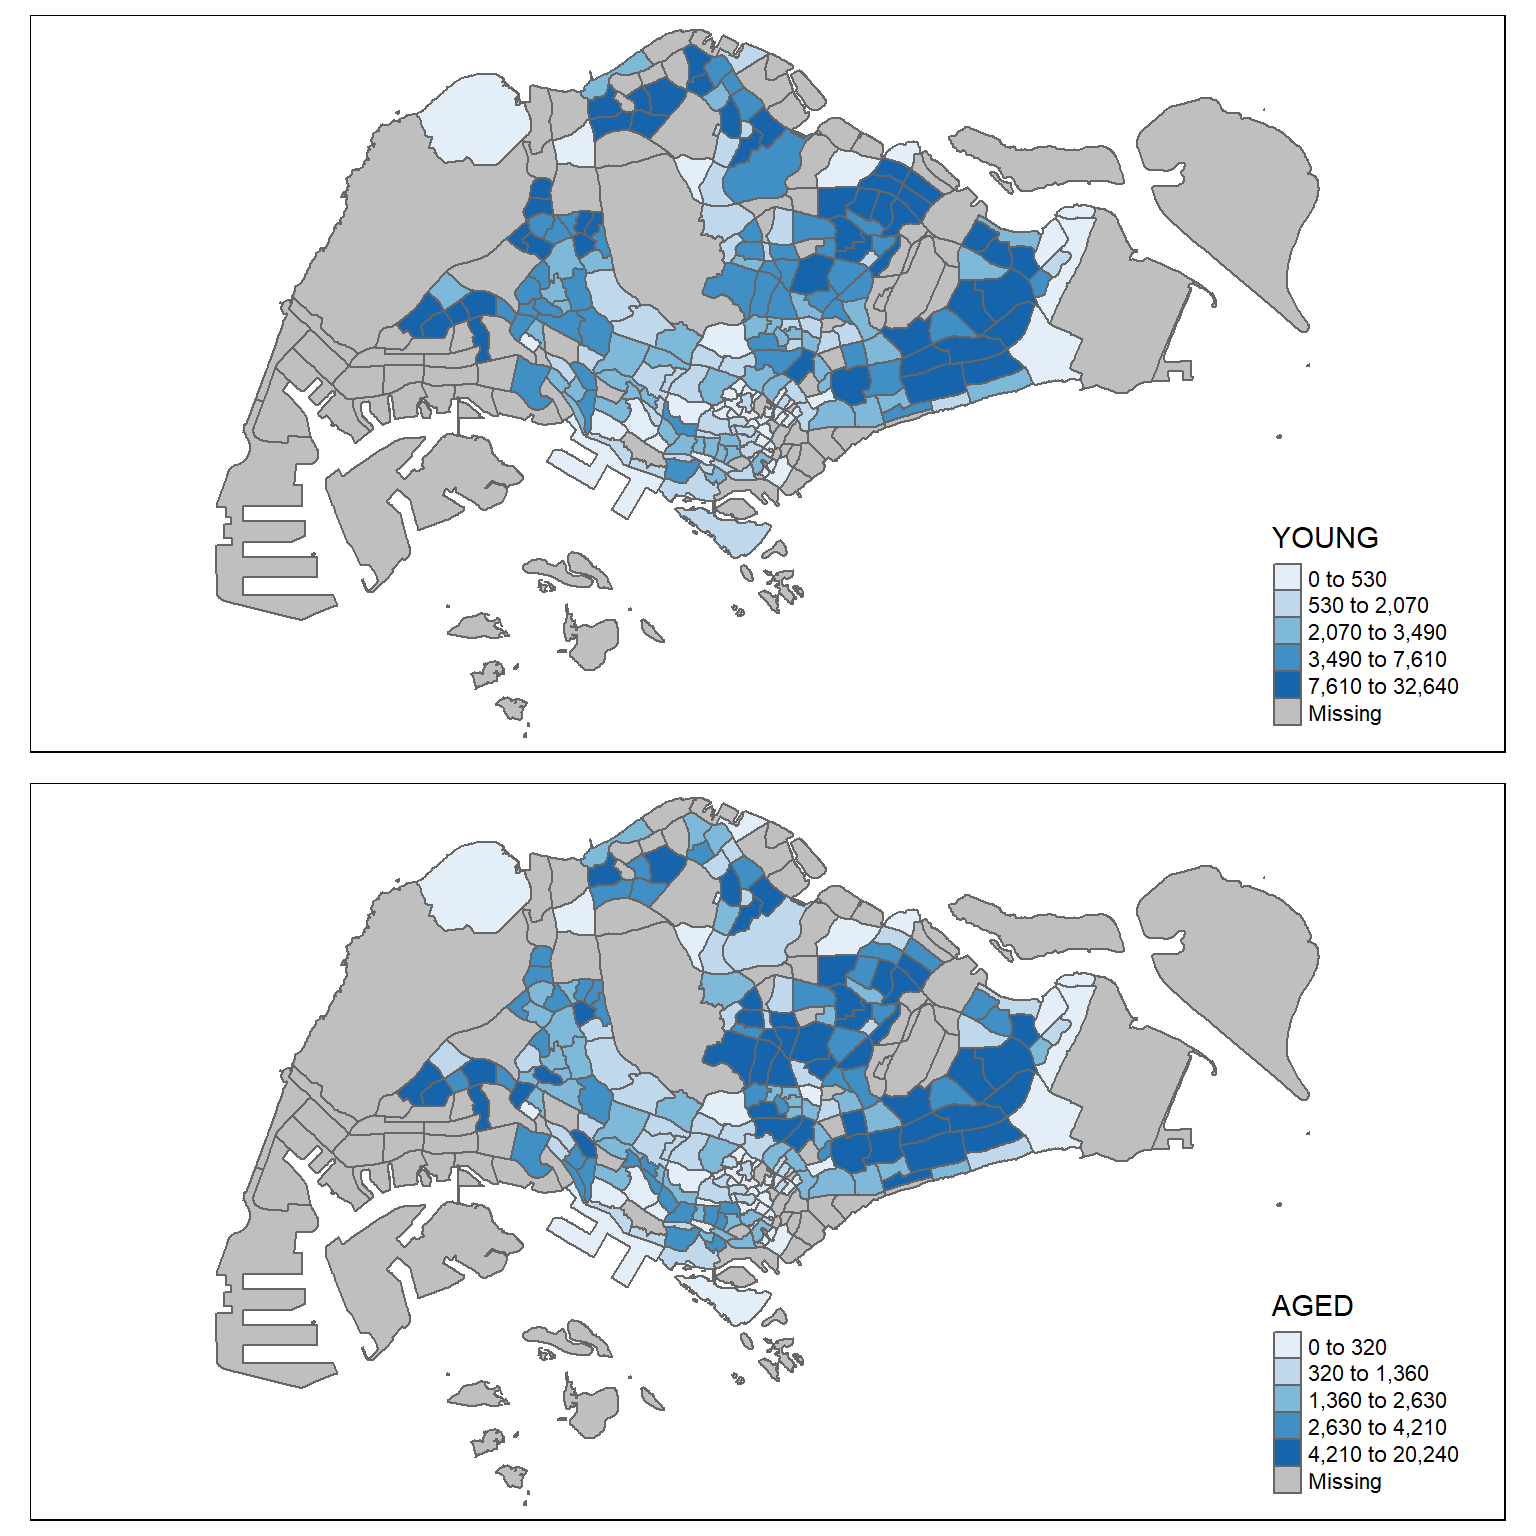
In this example, small multiple choropleth maps are created by defining ncols in tm_fill().
In this example, small multiple choropleth maps are created by assigning multiple values to at least one of the aesthetic arguments
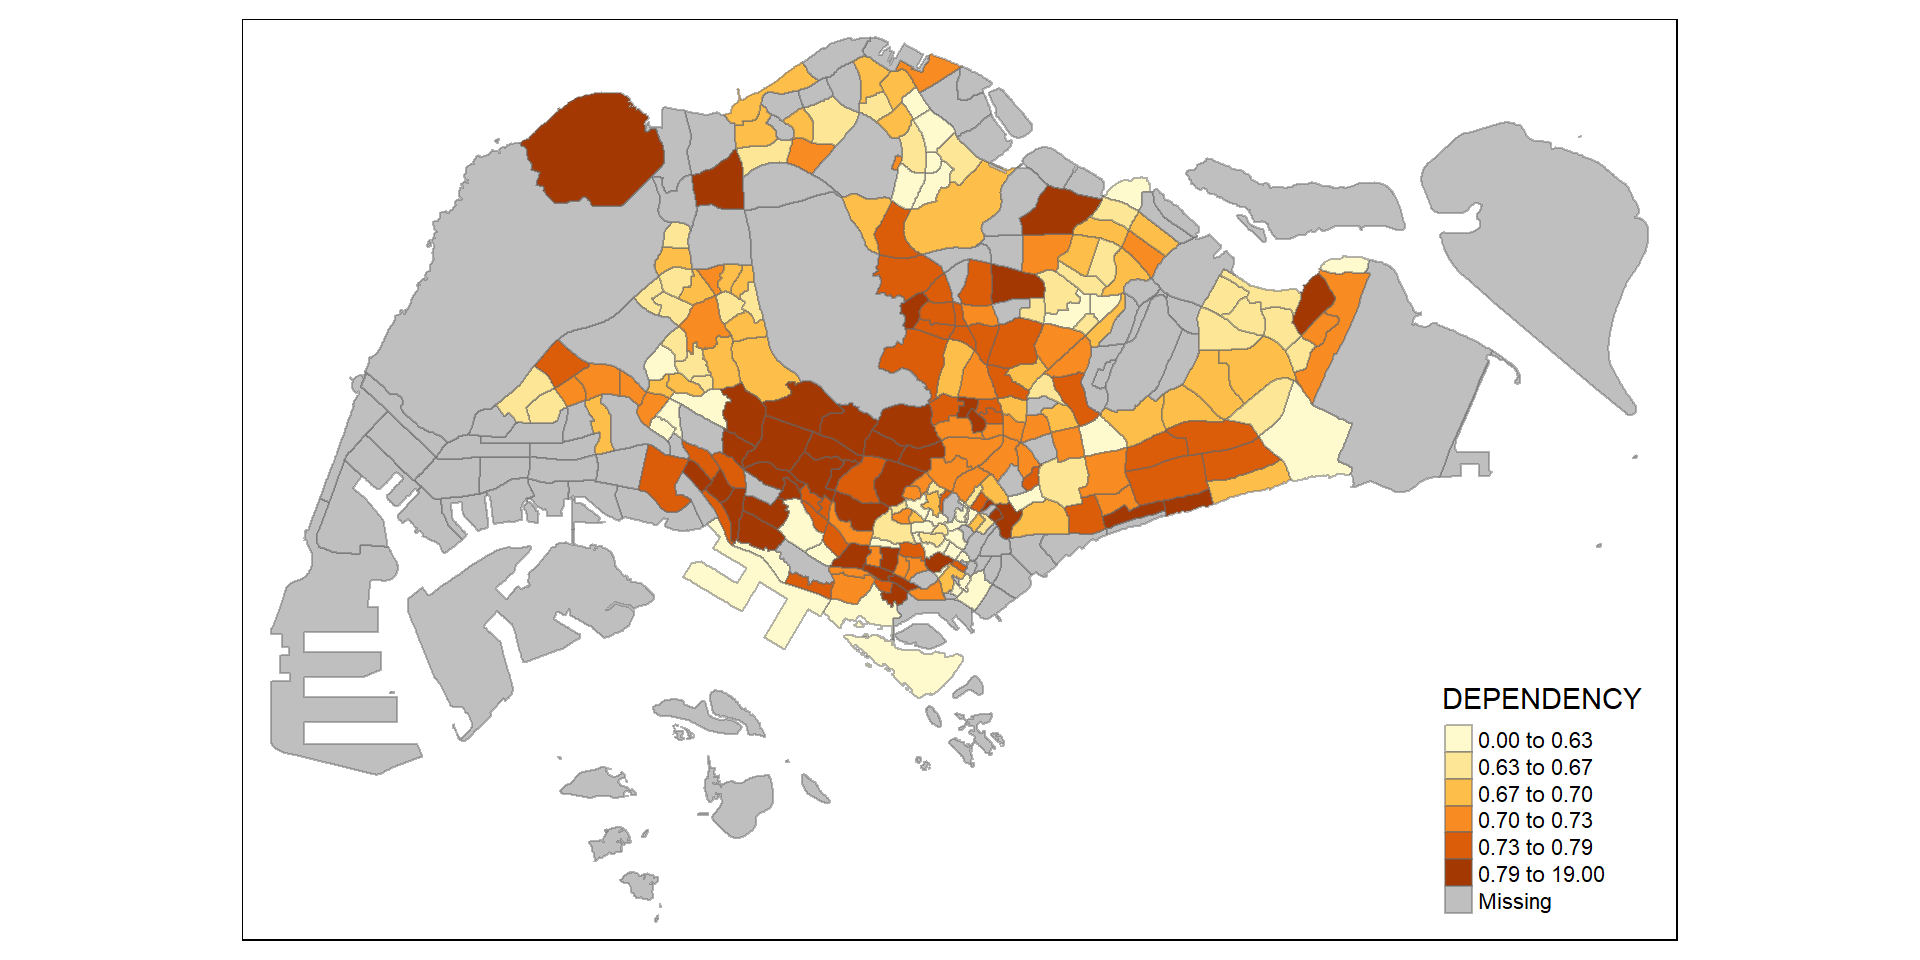
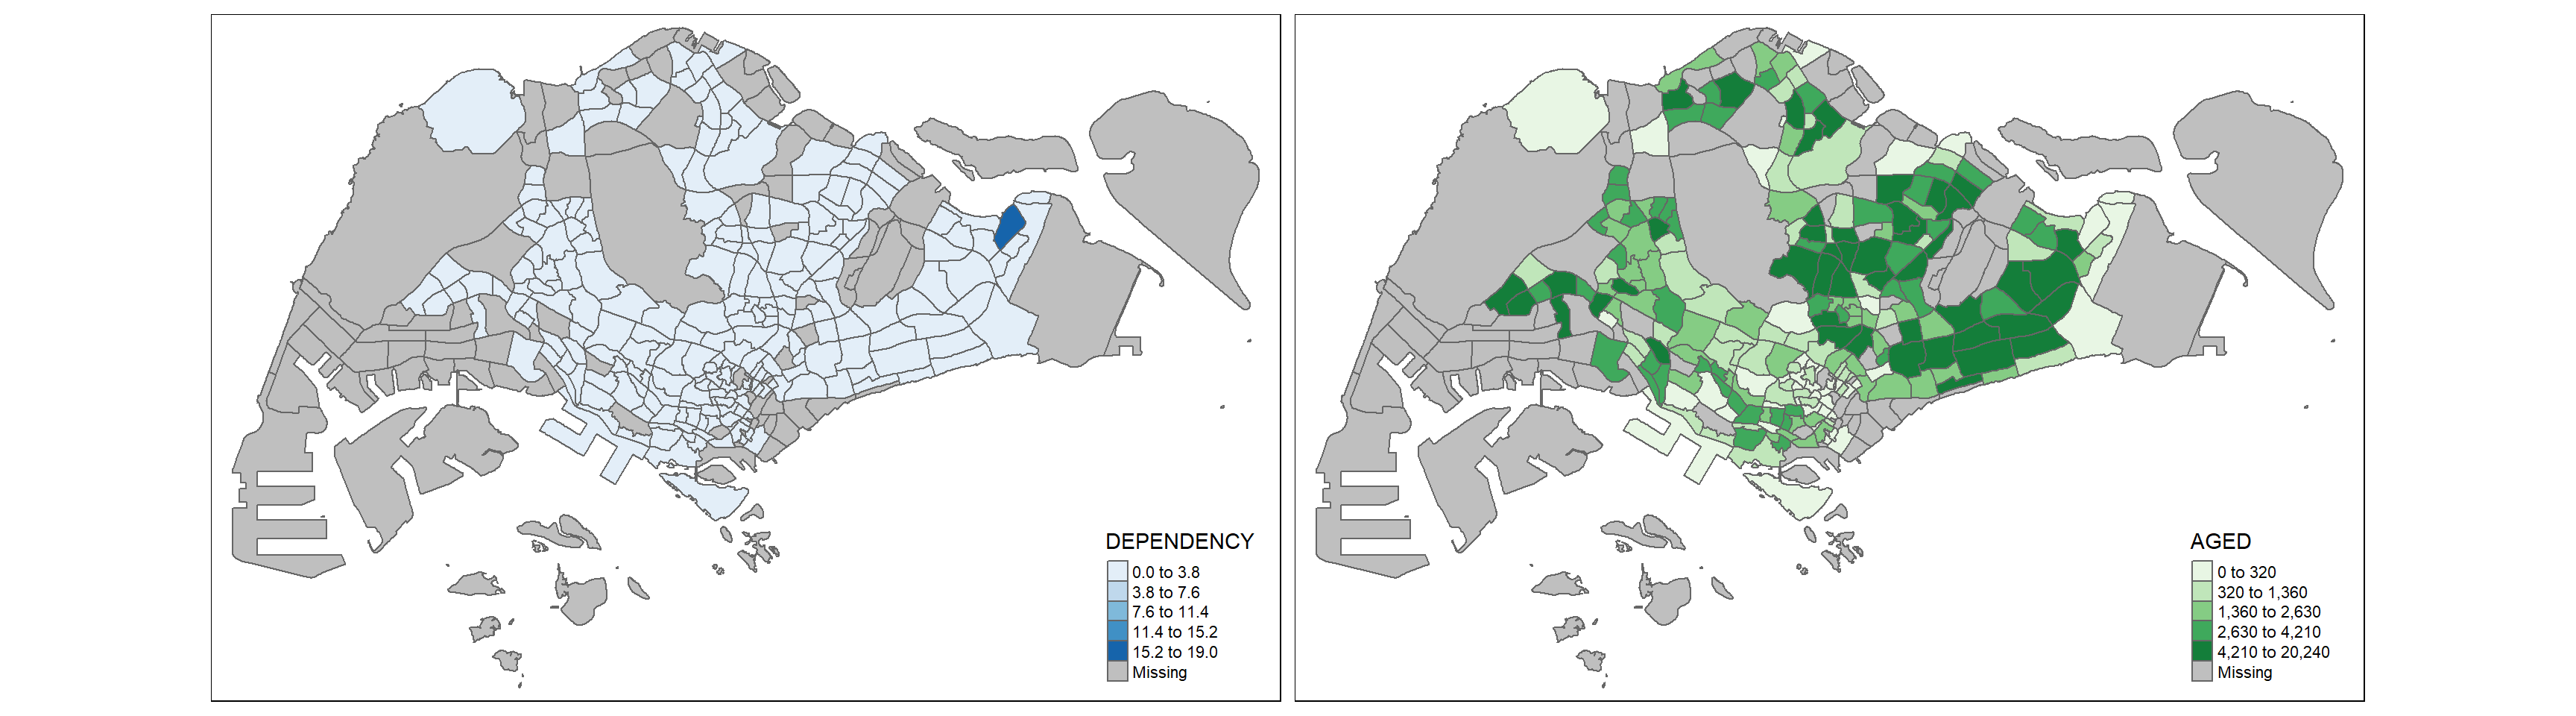
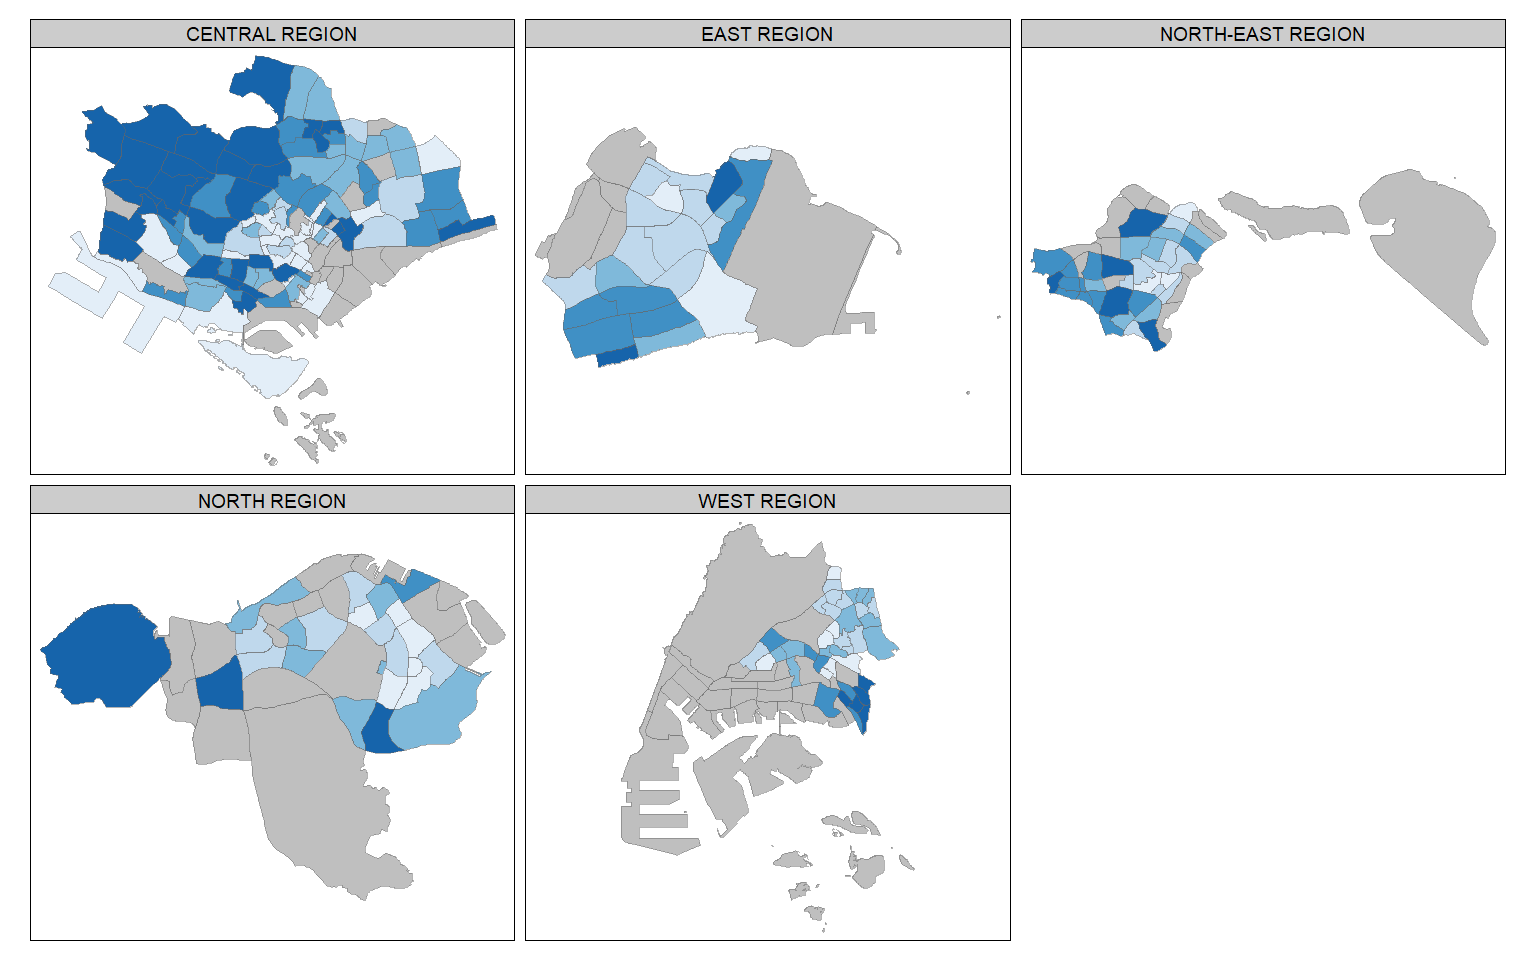
tmap_arrange()In this example, multiple small choropleth maps are created by creating multiple stand-alone maps with tmap_arrange().
tm_facets()In this example, multiple small choropleth maps are created by using tm_facets().
Instead of creating small multiple choropleth map, you can also use selection function to map spatial objects meeting the selection criterion.
tm_shape(mpszpop2020
         [mpszpop2020$REGION_N=="CENTRAL REGION", ]) +
  tm_fill("DEPENDENCY",
          style = "quantile",
          palette = "Blues",
          legend.hist = TRUE,
          legend.is.portrait = TRUE,
          legend.hist.z = 0.1) +
  tm_layout(legend.outside = TRUE,
            legend.height = 0.45,
            legend.width = 5.0,
            legend.position = c("right",
                                "bottom"),
            frame = FALSE) +
  tm_borders(alpha = 0.5)